Why FactoryLOOK Outperforms Power BI in Industrial Contexts Img

Why FactoryLOOK Outperforms Power BI in Industrial Contexts

Introduction

Manufacturing today runs on information as much as it does on machines. Modern factories generate massive streams of data from machines, sensors, and processes. Turning this raw information into timely, actionable insights requires more than traditional reporting tools.  

Advanced analytics tools help factories track operations in real time, keep data secure, and provide dashboards built for manufacturing needs.  

In this blog, we compare Vistrian FactoryLOOK and Power BI to understand which analytics platform is better suited for your factory needs.

Live Factory Insights

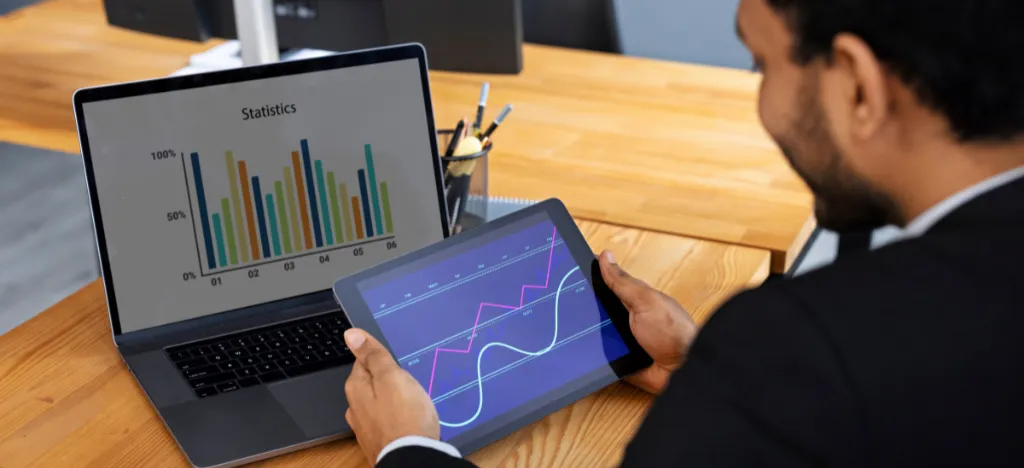
In factories and manufacturing units, timing is critical. Real-time visibility ensures that data from machines, sensors, and systems is not just collected, but acted upon instantly. This constant flow of live information keeps operations transparent and predictable.

By identifying issues the moment they arise, real-time monitoring reduces downtime and keeps production moving smoothly. Operators gain the power to respond quickly, ensuring processes stay efficient and reliable.

Features Vistrian FactoryLOOK Power BI
Data collection Collects real-time data from machines & sensors to surface anomalies immediately. Supports real-time visuals via streaming datasets.
Alert and response Sends immediate alerts if bottlenecks are detected. Can send alerts but needs careful stream design.
Latency Designed for continuous feeds. Streams live data. Streams data up to eight hours per day.
Why FactoryLOOK Outperforms Power BI in Industrial Contexts Img

Shop Floor Interfaces

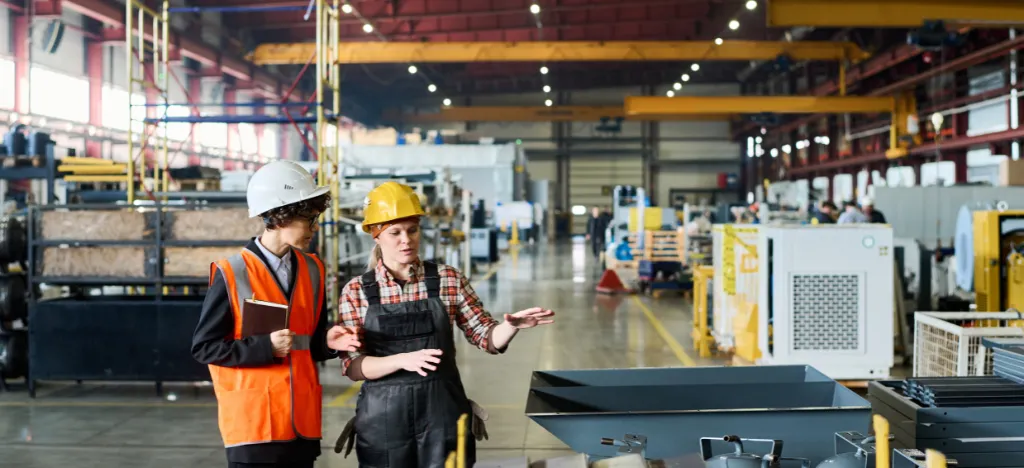
Dashboards play a vital role in turning production data into clear insights. For operators and supervisors, good interfaces mean less time searching for information and more time making informed decisions.

When dashboards are tailored to factory needs, they highlight the right metrics at the right time. This not only simplifies monitoring but also lets teams identify problems quickly and maintain consistent production quality.

Features Vistrian FactoryLOOK Power BI
OEE/throughput/shift views Comes with ready views for production KPIs and insights. Views can be custom built rather than product native.
Role-based screens Provides multi-screen dashboards for operators. Shop-floor experience depends on how reports are made.
Problem Detection Built to link processes and highlight problems immediately. Needs custom setup with data models and formulas.
Why FactoryLOOK Outperforms Power BI in Industrial Contexts Img

Scalable and Secure Systems

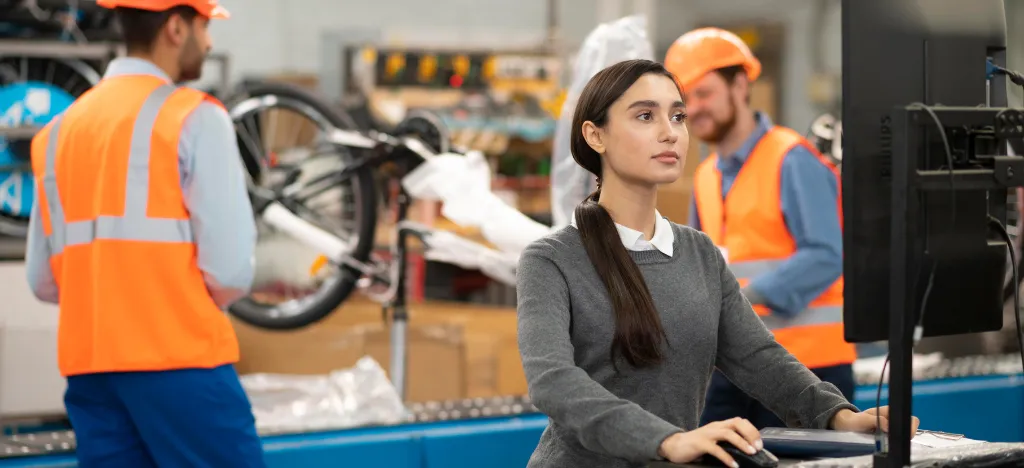
For factories, security is the backbone of operational stability. Safeguarding machine data, access controls, and production environments ensures that systems remain resilient against risks.

At the same time, scalability determines how well technology adapts to growth. As operations expand, platforms must process higher data volumes and support more users without compromising speed or reliability. Together, security and scalability enable future-ready manufacturing.

Features Vistrian FactoryLOOK Power BI
Security Protects machine data with on-prem and edge security. Focused on enterprise IT security.
Data governance & roles Designed for operators and supervisors to act on events. Controls who can see data using role-based settings.
Licensing model Sold as a factory-focused solution, pricing based on deployment. Low cost per-user license, but advanced features require premium plans.
Why FactoryLOOK Outperforms Power BI in Industrial Contexts Img

Conclusion

Factories work best when data is turned into action. Real-time awareness, easy-to-use dashboards, and secure systems that can grow with the business help teams make better decisions and keep performance steady over time. With Vistrian’s suite of tools, manufacturers can turn data into steady performance.

Interoperable IIoT: Bridging Protocols for Smarter Plants Img

Interoperability In IIot: Ensuring Seamless Communication

Introduction

Factories are entering a new rhythm that includes shorter cycles, smarter assets, and teams working from real-time information. Data once locked inside machines now flows across lines and sites, turning today’s status into tomorrow’s plan.

To keep pace, decision-making must be as real-time as the shop floor itself, with clear views, faster responses, fewer surprises. And this is being made possible with interoperability in IIoT, so everything can communicate reliably.

In this blog, we explore what is interoperability in IIoT and why it matters in operating a modern factory.  

Interoperability in IIoT

Interoperability in Industrial IoT (IIoT) is the ability of sensors, machines, PLCs, and enterprise systems to exchange, understand, and act on information reliably. It is a shared language for the shop floor. 

This shared language aligns syntax (protocols, payloads) and semantics (meaning, context) so data flows across OT and IT layers without errors. With smooth communication, teams plug in new tools faster, spot issues earlier, and feed clean data to AI that boosts quality, energy use, and uptime.  

Interoperable IIoT: Bridging Protocols for Smarter Plants Img

Interoperability for AI on the Factory Floor

Interoperability is the foundation of effective IIoT. Machines, sensors, and software exchange data through standardized interfaces, a common data model, and consistent timestamps.

For AI analytics, this consistency is critical. Clean and timely data produces reliable features, real-time alerts, and trustworthy recommendations. Without it, teams struggle with silos and brittle integrations, so models are slow to deliver value.

On the shop floor, interoperable data gives operators and engineers a single, accurate view of performance. That clarity helps cut defects, speed changeovers, and reduce energy use. It also improves control and makes it easier to manage access, prove compliance, and scale smart manufacturing and digital transformation.  

Interoperable IIoT: Bridging Protocols for Smarter Plants Img

How Interoperability Powers Industry 4.0

Industry 4.0 is about connected, responsive factories. Interoperability is the rulebook that lets equipment, software, and people exchange and understand data from end to end. When machines and systems share a common way to describe events, measurements, and status, information flows cleanly from the line to planning and service.

With that foundation, IIoT and AI analytics deliver practical wins such as early fault detection, quicker changeovers, and improved quality control. Plants can plug in new tools, bring legacy systems into the network, and reuse solutions across lines and sites.

Interoperability also supports governance and security, helping digital transformation move faster and with less risk.

Interoperable IIoT: Bridging Protocols for Smarter Plants Img

Conclusion

Interoperability in IIoT is the next big step for manufacturing. When machines and systems share a common language, data stays clean, and decisions get faster. Plants add new tools without disruption and scale proven solutions across sites. Start by standardizing how you communicate and let smarter operations follow. 

Smart Dashboards: Complete View for Plant Performance Image

How Do Smart Dashboards Improve Plant Performance?

Introduction

Manufacturers are adopting connected technologies that shrink the gap between signal and response. All the activity on the factory floor is captured in a single flow, making it easier to see and act. Smart dashboards turn that flow into a clear picture, highlighting what is steady, what is drifting, and what needs action now.

In this blog, we explore how smart dashboards improve plant performance and how it benefits the factory floor and the manufacturers together.

Smart Dashboards: Complete View for Plant Performance Image

How do smart dashboards deliver real-time visibility and early action?

Smart dashboards turn scattered signals into a single, live picture of the plant. Teams see KPIs at machine, line, and site level in one place, so gaps and drifts are easy to spot. When performance slips, the system highlights the anomaly and shows likely causes. Everyone works from the same view, which improves handoffs and speed.

With Industrial IoT data and AI analytics, alerts arrive before small issues become downtime. Thresholds, trends, and patterns point to early fixes and support predictive maintenance. Manufacturers can assign owners, add due dates, and track progress inside the dashboard.

Do smart dashboards improve quality while cutting costs?

Smart dashboards lift throughput by keeping the bottleneck in plain sight. Teams see which machine is slowing the shift and can rebalance work, shorten changeovers, and avoid downtime. Live OEE makes priorities obvious, so supervisors can act quicker. The result is steadier flow and fewer surprises.

This improves quality while reducing costs. Smart dashboards reveal waste hotspots, guiding small adjustments that add up. These gains compound over time, turning digital transformation into measurable results.

Smart Dashboards: Complete View for Plant Performance Image

How do Vistrian tools improve plant performance?

Vistrian’s suite of tools connects machines, people, and decisions so data turns into timely action on the floor. Vistrian FactoryLOOK converts machine and sensor signals into a clean, live view at machine, line, and plant level. Smart dashboards surface bottlenecks and anomalies as they form.

VistrianMMS keeps maintenance organized and on schedule. Alerts flow into work orders with owners, due dates, and parts lists. Manufacturers can follow clear checklists, and close tasks faster, which cuts unplanned downtime and extends asset life.

VistrianMES provides real-time work-in-progress and traceability. It enforces standard workflows and records quality checks. Supervisors can see the next step and keep production on track.

Smart Dashboards: Complete View for Plant Performance Image

Conclusion

Smart dashboards bring the floor into focus. By unifying data and applying analytics, they move teams from reactive actions to predictable operations. In the long run, these capabilities will sustain continuous improvement and make performance gains repeatable across lines and sites resulting in a scalable manufacturing system.

Vistrian Analytics vs GE Predix: Real-Time vs Predictive Analysis Img

Vistrian Analytics vs GE Predix: Real-Time vs Predictive Analysis

Introduction

In modern manufacturing, anticipating problems before they happen is critical. Downtime, quality deviations, or supply chain bottlenecks can derail schedules and increase costs. 

Here is a factual comparison between two industrial analytics: GE Predix, a cloud-based predictive platform, and Vistrian Analytics, the predictive and AI-driven analytics feature within FactoryLOOK. Both harness data to improve operational efficiency, but their methods, speed, and focus differ. 

This comparison helps manufacturers understand which approach best fits their shop-floor needs and predictive maintenance strategy.

1. Predictive Analytics Approach

Before deciding which predictive analytics solution to adopt, it’s essential to
understand how each platform gathers, processes, and translates data into actionable insights. Different approaches
have different strengths depending on the needs of your factory. 

Some features, like Vistrian Analytics within FactoryLOOK, are designed to deliver real-time, actionable intelligence directly to
the shop floor, allowing operators and supervisors to respond instantly to anomalies, quality deviations, or
equipment issues. Here is the detailed comparison to help manufacturers make the right choice: 

Aspect Vistrian Analytics (FactoryLOOK) GE Predix
Data Type Real-time machine and process data from the shop floor Cloud-aggregated historical and near-real-time data
Focus Immediate detection of performance anomalies, process deviations, and quality trends Long-term trend analysis, forecasting asset failures, and predictive maintenance planning
Actionability Operators and supervisors can act instantly to prevent downtime or defects Recommendations often require planning cycles and technical interpretation
Integration Embedded within FactoryLOOK; integrates directly with production data and dashboards Requires connection to machines via gateways and cloud integration; may need developer support
Vistrian Analytics vs GE Predix: Real-Time vs Predictive Analysis Img

2. Speed of Insights

Understanding how quickly predictive insights translate into action is critical for factories where every second of downtime or quality deviation can affect productivity and profitability. On fast-moving production floors, delays in response can lead to extended downtime, increased scrap, or missed delivery schedules.
For manufacturers, understanding this real-time versus delayed response distinction is key to choosing the right analytics approach for their operational priorities. Here is the detailed comparison:

Aspect Vistrian Analytics (FactoryLOOK) GE Predix
Analysis Timing Live, real-time insights as production occurs Analysis occurs in the cloud; latency depends on data upload and processing
Response Immediate alerts for anomalies, quality shifts, and equipment behavior Predictive alerts generated based on historical patterns and models
Ideal Use Case Fast-paced discrete manufacturing, high-frequency monitoring Enterprise-scale predictive planning and multi-site maintenance strategy
Vistrian Analytics vs GE Predix: Real-Time vs Predictive Analysis Img

Shop-Floor Impact

  • Vistrian Analytics empowers teams to spot root causes instantly, minimize defects, and maximize uptime using AI-driven insights directly from FactoryLOOK dashboards.
  • GE Predix provides strategic foresight, helping engineers and managers plan maintenance, optimize asset performance, and forecast failures but typically does not deliver live, actionable shop-floor alerts.

Vistrian Analytics vs GE Predix: Real-Time vs Predictive Analysis Img

Choice Depends on Your Needs

If your priority is real-time preventive action and operational clarity on the floor, Vistrian Analytics within FactoryLOOK is ideal. It turns live machine and process data into immediate, actionable insights. 

Understanding the distinction between real-time predictive insights and cloud-based predictive planning ensures manufacturers select the approach that truly drives uptime, quality, and efficiency.