Introduction
Factories today are built on a foundation of data. From the first signal on the shop floor to the final shipment, every step leaves behind information that shapes decisions and outcomes. This flow of data acts like the nervous system of manufacturing.
In this blog, we explore how real-time data shapes the working of VistrianMES and what benefits factories can derive from it.
Turning floor signals into action
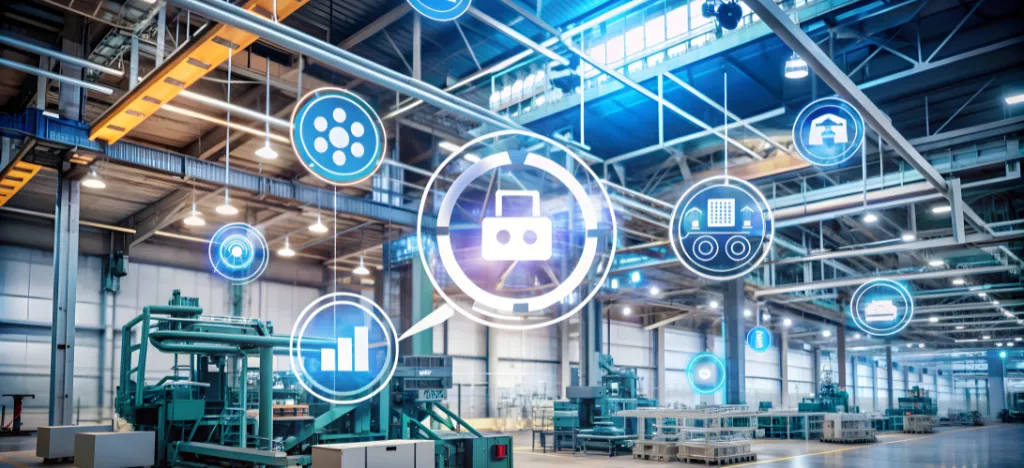
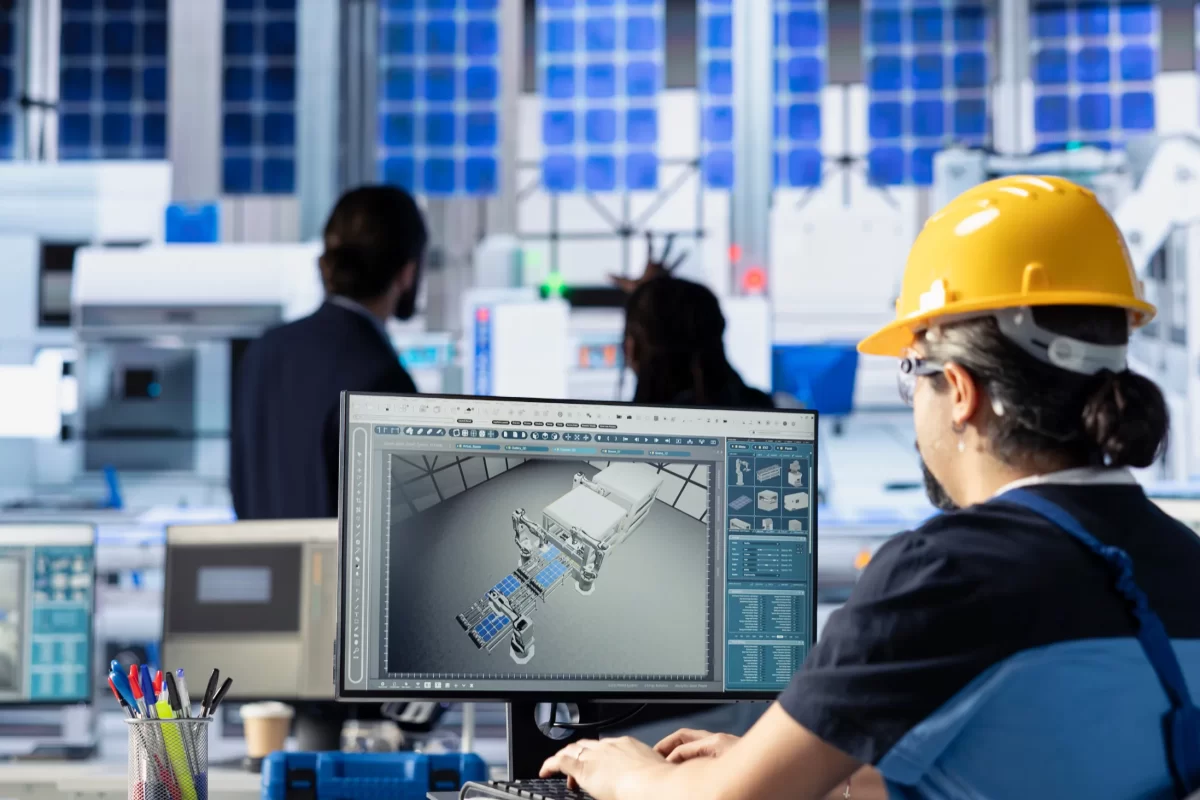
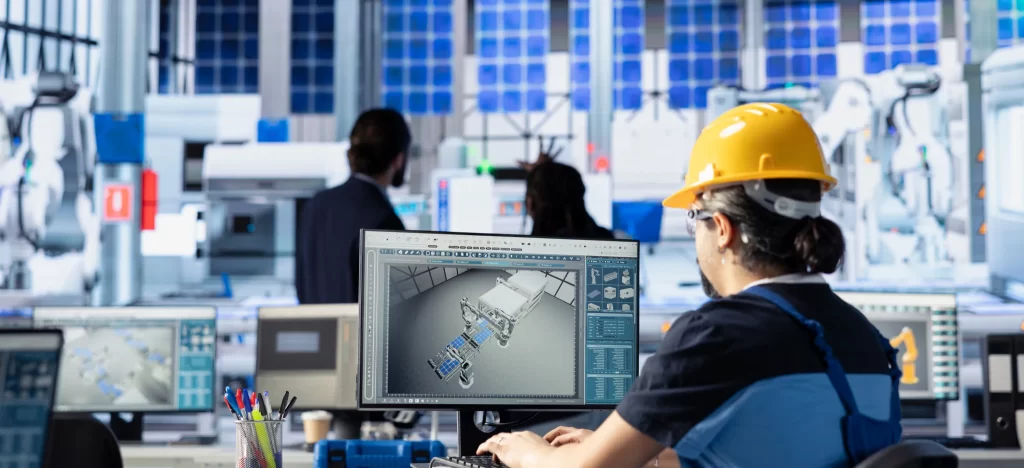
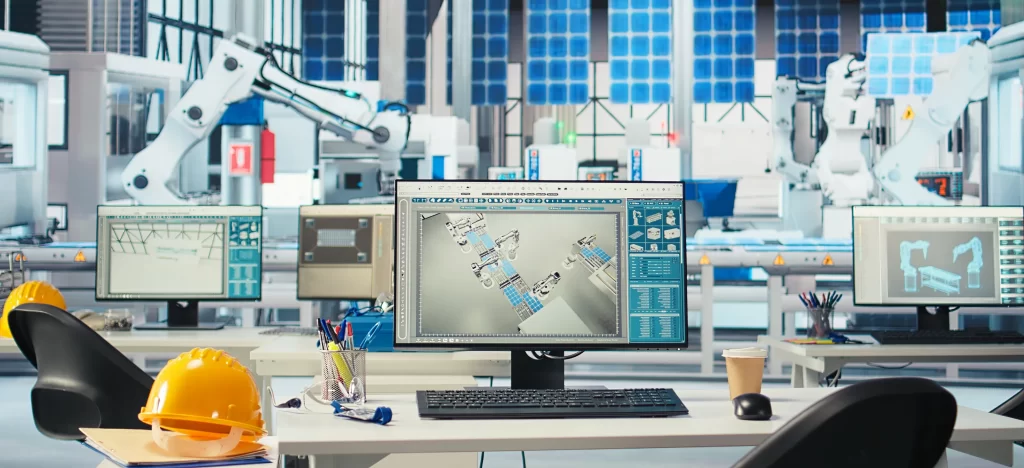
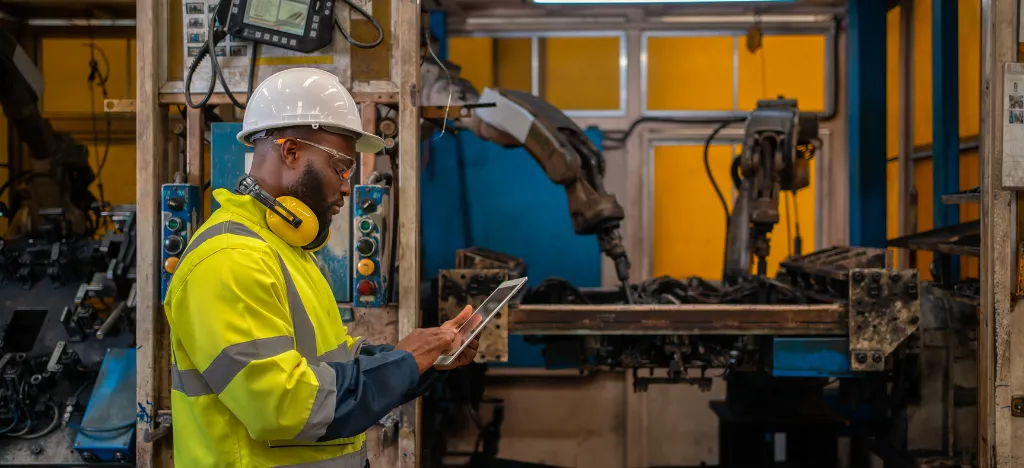
MES (Manufacturing Executive System) is a software system that monitors, tracks, and controls the production process on a factory floor in real-time. Without timely signals from machines, materials, and operators, it cannot guide or improve production. Real-time data gives every role a clear starting point for action. Operators see whether a line is running within limits, supervisors compare plan versus actual result, planners check materials and work-in-progress, maintenance prioritizes what to fix first. With IIoT connecting machines and stations, the right facts surface faster.
When analytics highlight drifts and patterns, small issues are caught before they become downtime. For example, a temperature nudge prompts a quick adjustment, a low-stock cue triggers a timely pick, and a rising scrap trend flags a check before targets slip.
The result is fewer surprises, cleaner handoffs, and a shared picture of what matters now so decisions move at the pace of the shop floor.
From IIoT streams to decisions
A strong MES data layer makes IIoT useful by turning raw readings into reliable, real-time data that people can act on. It starts with clean, consistent inputs, shared units, names, and simple checks that keep numbers accurate. Each event is wrapped with context like order, line, and step, so analytics can explain where performance shifted and why.
From there, the stream is filtered to highlight exceptions and summarized into a clear set of KPIs. When something drifts, the system assigns an owner and a next step (checks, approvals, workorders) so alerts become action.
VistrianMES for enhanced factory operations
Turning insights into everyday improvements requires more than data alone. It calls for a system built for the shop floor.
VistrianMES builds on the factory’s data backbone to deliver real, measurable improvements in operations. By capturing real-time data from machines, materials, and workflows, it creates a single source of truth that every team can rely on.
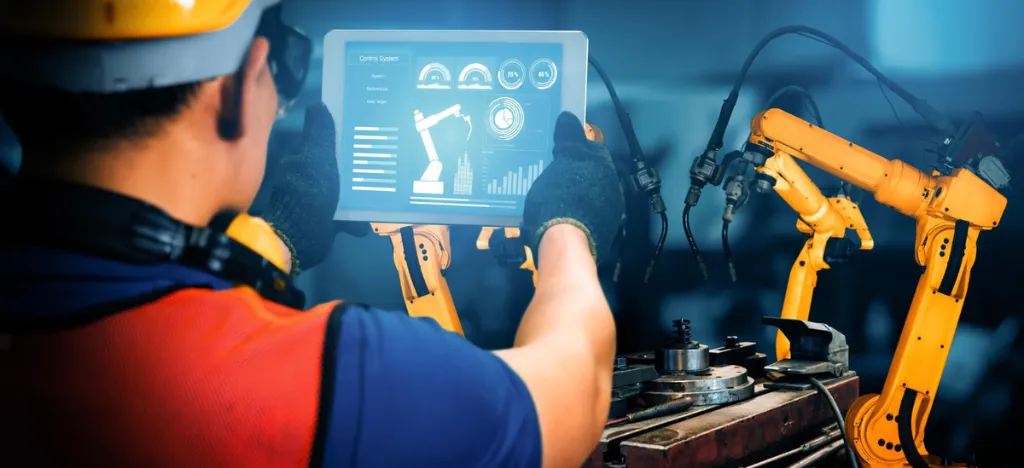
Through built-in analytics, AI-driven alerts, and IIoT connectivity, VistrianMES helps supervisors stay on schedule, quality teams enforce standards, and maintenance prioritise the right tasks. Integrated with ERP (Enterprise Resource Planning) MES systems allow for seamless data flow, improving overall operational visibility.

Conclusion
A strong data backbone is what transforms factory signals into meaningful action. By ensuring clean, and connected data, manufacturers can move from reacting to anticipating. VistrianMES builds on this foundation, turning insights into decisions and decisions into outcomes.