
Introduction
Walk any machine shop floor at 2 p.m. and you'll see it: a CNC machine sitting quiet, spindle off, no chips flying. Is it waiting on a fixture? Down for an alarm? Between jobs? Nobody's quite sure, and that uncertainty compounds fast.
Unplanned downtime is expensive at any scale. Siemens' 2024 downtime study found that an idle line at a large automotive plant can cost up to $2.3 million per hour, or $695 million annually. Those stakes scale down for smaller shops, but they never disappear.
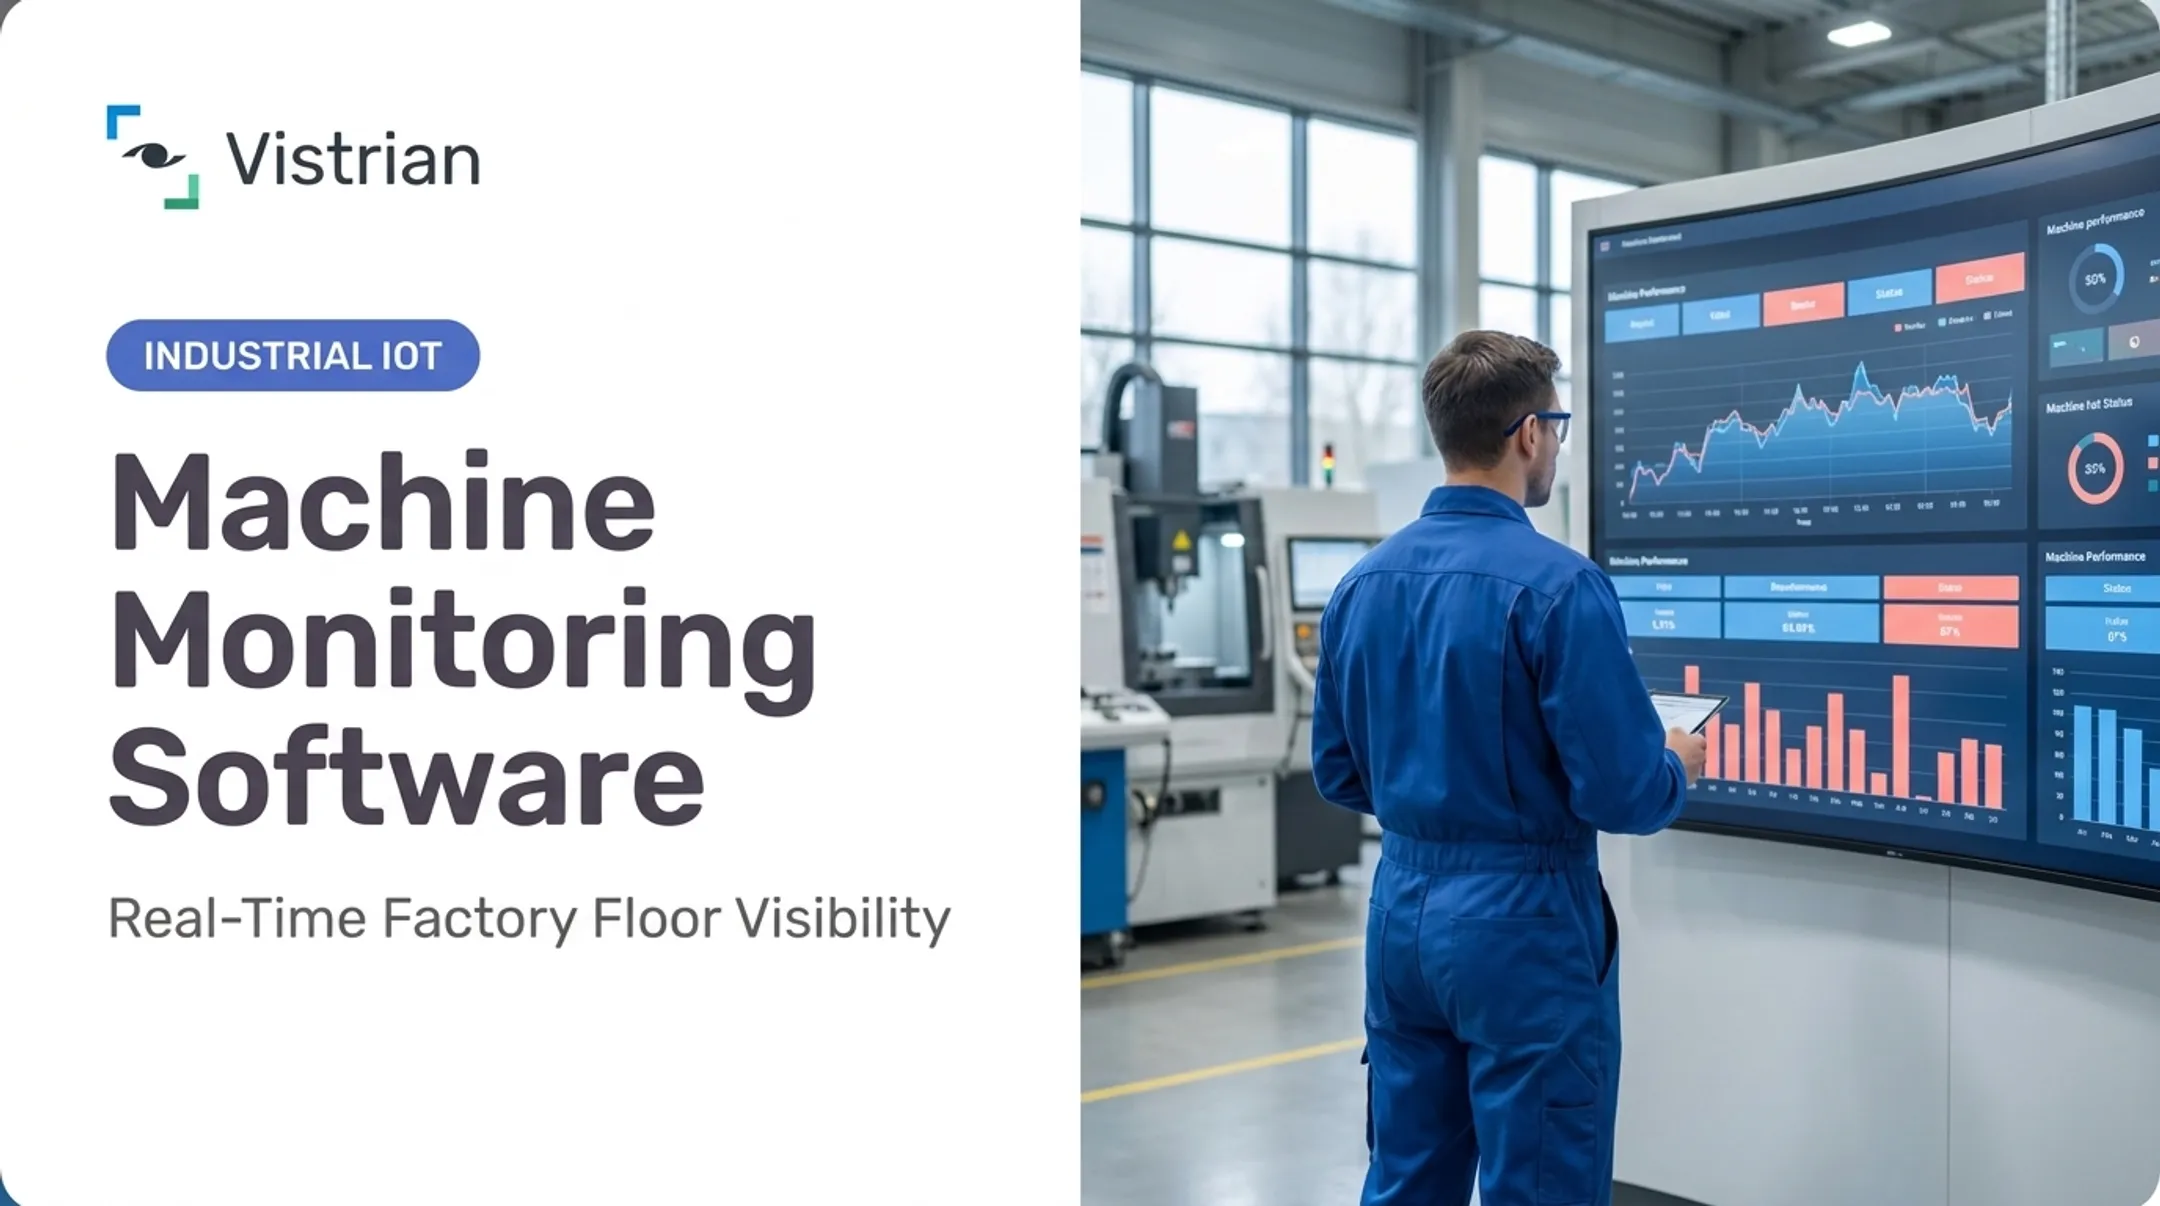
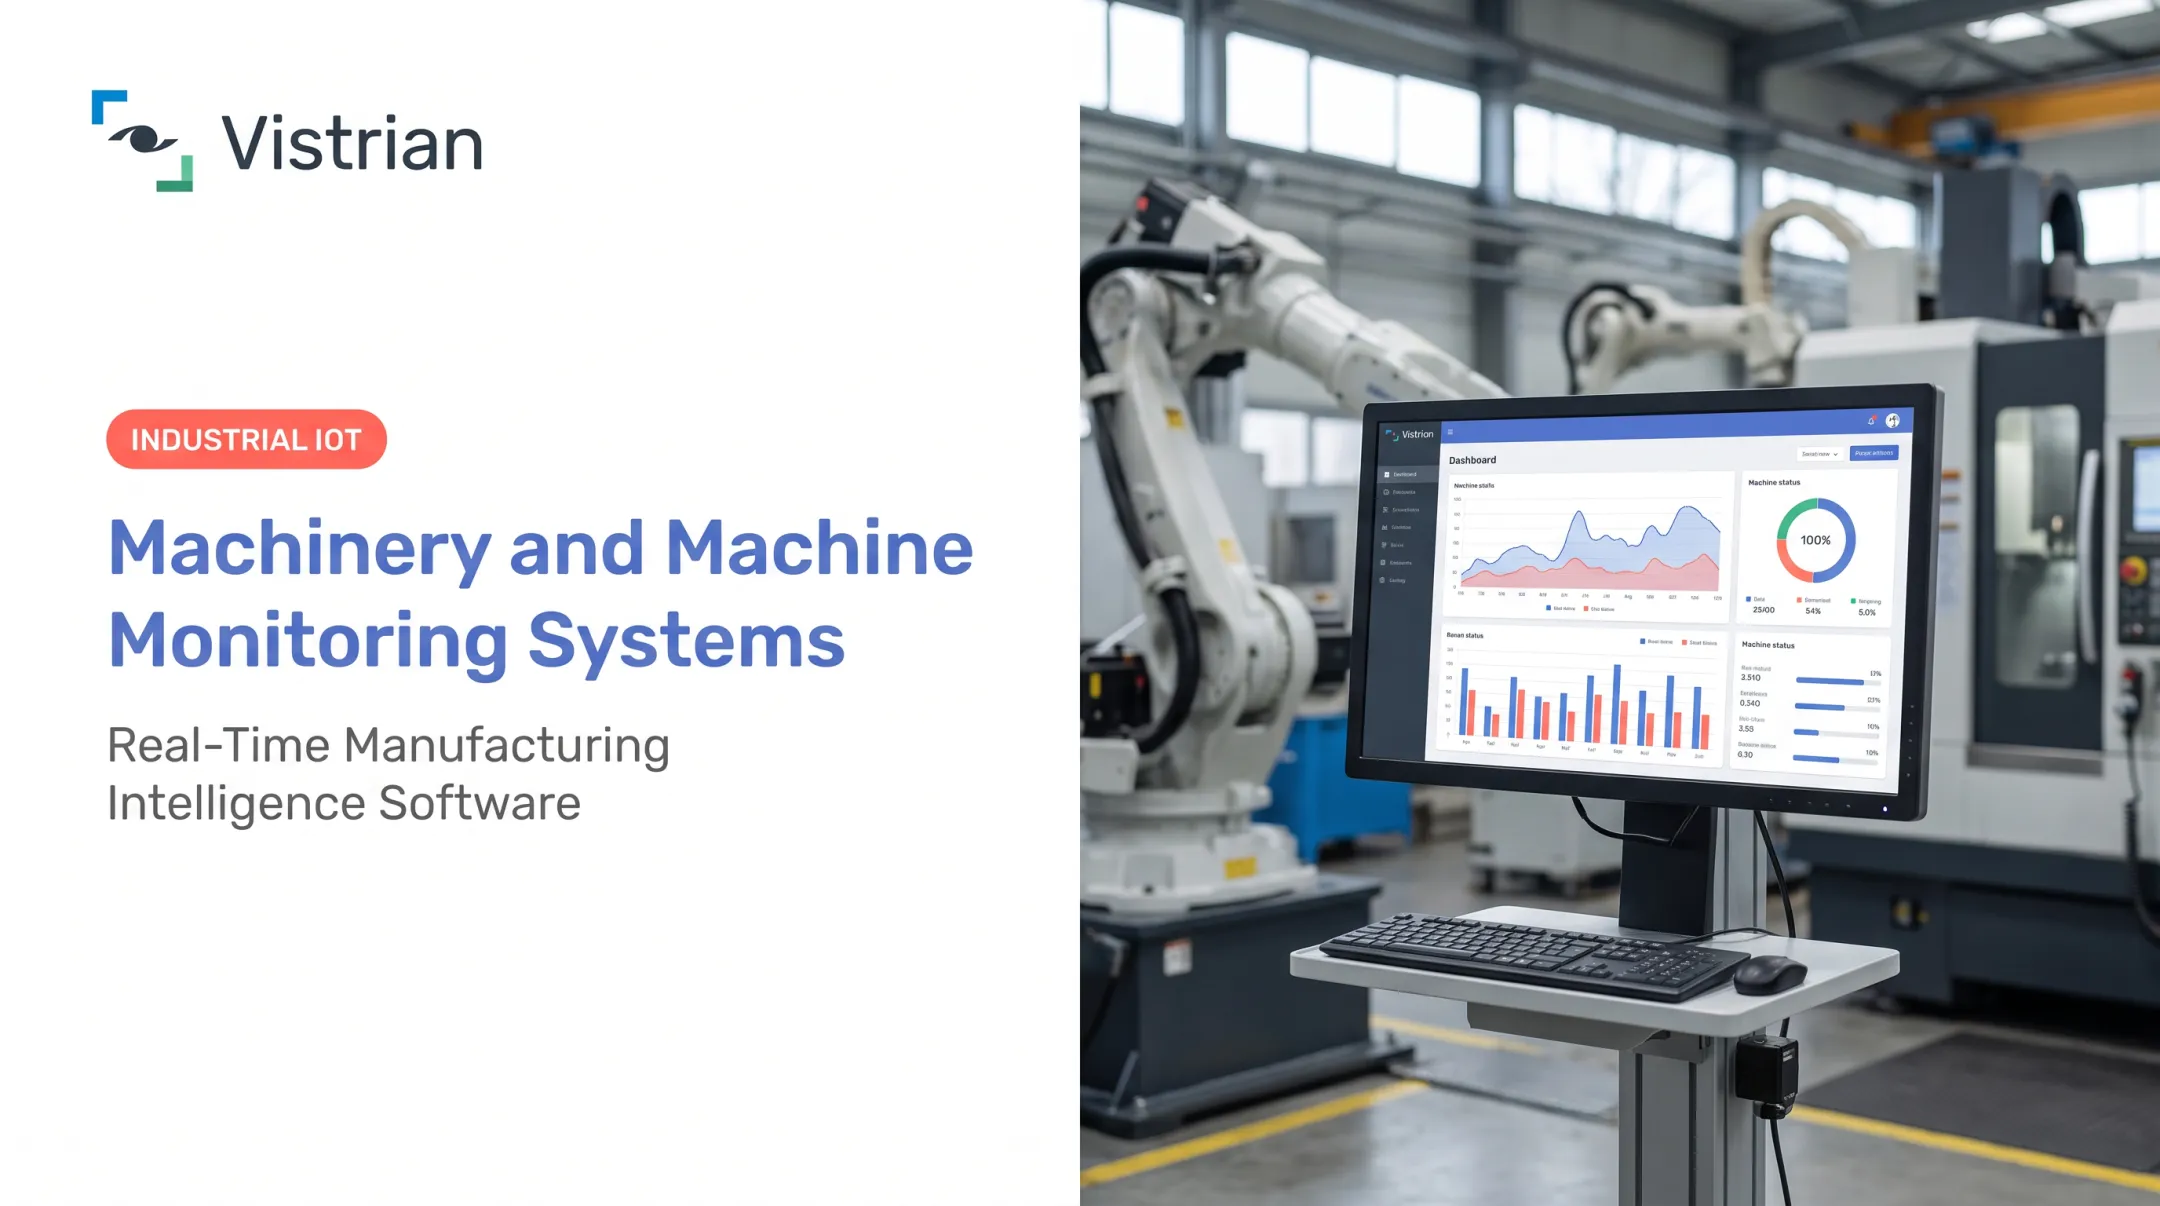
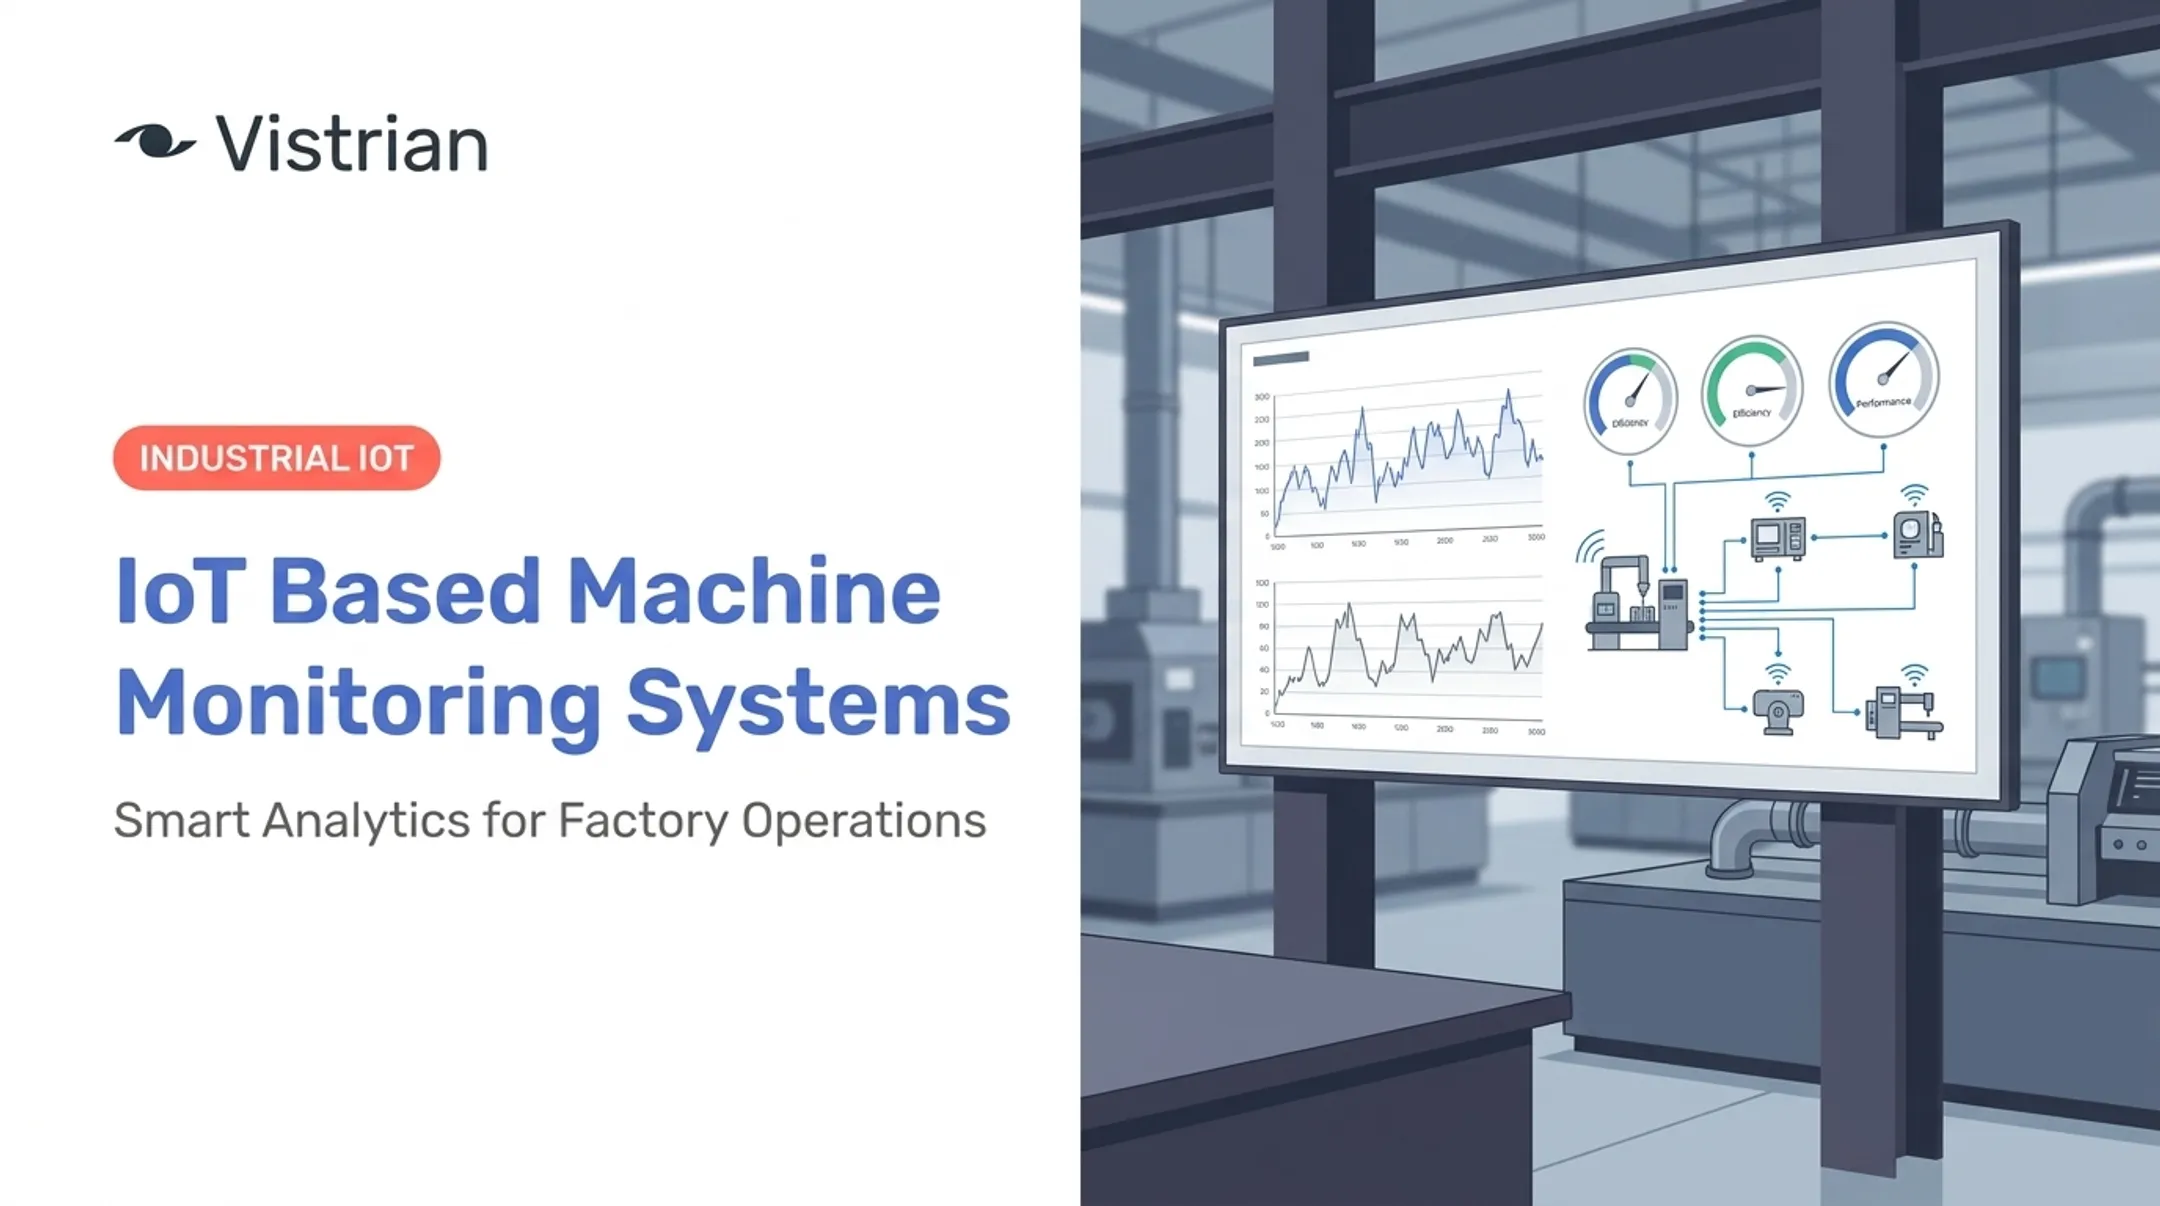
CNC machine monitoring systems close that visibility gap. They're software and connectivity tools that pull data from machine controls, sensors, and shop-floor systems. That data feeds live dashboards, alerts, and reports showing exactly what's happening on every machine in real time.
This guide covers how CNC monitoring actually works, the data and features worth evaluating, and a practical framework for choosing and rolling one out.
Key Takeaways
- CNC monitoring replaces manual estimates and delayed shift reports with continuous, machine-generated data.
- The right system depends on your fleet, controller age, required data depth, and integration needs—not a generic checklist.
- Monitoring pays off only when teams act on it, driving gains in utilization, OEE, root-cause analysis, maintenance planning, and cross-plant benchmarking.
What Are CNC Machine Monitoring Systems?
CNC stands for computer numerical control: the digital instructions that tell a machine tool exactly how to move, cut, and drill. The CNC machine executes those instructions. A monitoring system is a separate layer that watches what the machine is actually doing and reports it back.
How CNC Monitoring Actually Works
Most systems follow the same basic sequence:
- Connect to the machine controller, sensors, or an existing data source such as a PLC or historian.
- Collect events and measurements—run states, alarms, cycle times, part counts.
- Normalize raw data into consistent, comparable formats.
- Display it through dashboards and scheduled reports.
- Trigger alerts or downstream workflows when something needs attention.

Basic vs. Advanced Monitoring
Not every system captures the same depth.
- Basic status monitoring identifies whether a machine is running, idle, stopped, in setup, or faulted—enough to spot obvious utilization gaps.
- Advanced monitoring layers in controller data, sensor readings, program details, alarms, part counts, cycle times, and maintenance records, giving teams the context to diagnose why a loss happened.
Vistrian's FactoryLOOK, for example, integrates with equipment, PLCs, sensors, and legacy systems to collect this kind of data, then runs it through a rules engine that flags anomalies and performance issues as they occur. That machine-level detail is useful on its own and as a clean data feed for broader plant systems.
Monitoring vs. MES
CNC monitoring isn't a Manufacturing Execution System (MES). An MES manages, tracks, and controls the entire production process, including scheduling and work orders. Monitoring stays narrower, focused on machine-level truth. The two work well together, though—monitoring data can feed an MES, ERP, quality system, or maintenance platform instead of manual entries and guesswork.
Why Manufacturers Use CNC Machine Monitoring
When a machine sits idle, the reason could be anything: waiting on material, an operator pulled elsewhere, a programming error, or a genuine mechanical fault. Manual downtime logs rarely capture this accurately, since operators fill them in after the fact, often in generic terms.
Automatically recorded machine states remove that guesswork. Instead of "machine down," you get "machine down: tool change, 14 minutes, 2:07 p.m." That level of detail makes root-cause analysis possible.
Operational Benefits You Can Measure
- Compare productive time, idle time, setup time, and unplanned stops against theoretical capacity
- Break OEE into availability, performance, and quality losses with downtime categories tailored to your operation
- Correlate alarms, cycle-time changes, and part counts so "machine keeps stopping" becomes a specific fix
- Use trends and alerts to move from reactive repairs toward preventive or predictive maintenance
VistrianMMS, for instance, pulls real equipment behavior from FactoryLOOK to schedule maintenance around actual wear patterns rather than a fixed calendar.
The same signals protect quality. Cycle-time drift, repeated short stops, or unusual machine behavior often appear before a batch goes bad, so teams can cut scrap and rework early.
Priorities Differ by Environment
| Environment | Typical monitoring priority |
|---|---|
| Job shops | Setup time, quoting accuracy, spindle utilization, job-level performance |
| High-volume operations | Cycle-time consistency, alarm frequency, part counts, automated escalation |
| Multi-plant organizations | Standardized KPIs and cross-site comparison |
Siemens research has found facilities average 25 downtime incidents and 27 lost hours per month. Those losses add up quickly, even outside large automotive plants.

Key Features and Data Sources to Evaluate
A useful system should capture, at minimum:
- Operating state (running, idle, stopped, setup, fault)
- Alarms and fault codes
- Program or job information
- Part counts
- Spindle or axis data
- Cycle times, feed rates, and speeds
- Operator-entered downtime reasons, where appropriate
Sensor-Based Monitoring for Older Equipment
Not every CNC exposes enough digital data on its own. For machines without a modern interface, supplemental sensors can fill the gap using signals like vibration, temperature, current draw, proximity, or power consumption. These show physical condition and activity even when the controller stays silent.
Choose sensors from your improvement goal, not the other way around. Predictive maintenance needs different signals than basic utilization—don't add sensors just because they're available. Platforms that combine controller data with IIoT sensors are especially useful on mixed-age fleets.
Connectivity and Compatibility
Real-world CNC fleets are rarely uniform. Look for systems that support modern protocols and APIs on newer controllers, plus options for legacy controllers, mixed-vendor equipment, machine logs, and databases through local edge or gateway hardware.
Legacy connectivity is a documented, solvable problem. AMT's MTConnect use case shows how an external adapter can translate an older machine's native data into a standard format, with an agent collecting and exposing it for dashboards and historians.
Dashboards, Integration, and Scalability
At minimum, expect:
- Live status views for operators and supervisors
- Historical trends for utilization, OEE, downtime, and cycle time
- Drill-down from line performance to machine, job, or event level
- Configurable alerts that flag exceptions instead of burying them in noise
Also verify:
- Integration with ERP, MES, CMMS, and quality systems
- Role-based access and clear data-retention policies
- Scale-up from a pilot machine to a full fleet without new data silos
A Vendor Demo Checklist
Features on a slide deck are not the same as features on your floor. Before signing anything, ask a vendor to show you, live:
- Connecting to a legacy CNC on your actual fleet, not a demo unit
- Classifying a downtime event by root cause
- Investigating an OEE loss end-to-end
- Exporting raw data
- Configuring a new alert from scratch
If they can't walk through all five in real time, treat that as a red flag.

How to Choose and Implement a CNC Monitoring System
Before looking at software, define what success means. Common objectives include:
- Reducing downtime
- Improving utilization
- Validating cycle times
- Supporting maintenance
- Improving quality
- Consolidating reporting across plants
Each objective points toward different priorities.
Audit Your Fleet and Data Environment
Document what you're actually working with:
- Machine brands, controller generations, and communication protocols
- Which machines are digitally accessible versus which need gateways or sensors
- Current manual records, spreadsheets, and ERP/MES dependencies
- Known data-quality gaps in existing reporting
This audit tells you where the hard integration work happens before you commit budget.
Run a Focused Pilot
Pick at least one machine that reflects your real connectivity challenges, not your easiest one. Establish a baseline for your target metrics before rollout, and decide up front who reviews alerts, how often, and what "improvement" looks like.
Structure the pilot to prove value quickly:
- Run long enough to capture normal mix and shift patterns (often about 30 days)
- Compare against your pre-pilot baseline, not vendor averages
- Include at least one legacy or hard-to-connect machine if that reflects your floor
- Assign owners for alerts, daily review, and go/no-go criteria
Platforms that connect controllers, logs, and IIoT sensors—such as Vistrian's FactoryLOOK—can shorten the path from pilot data to shared dashboards, but treat any published case-study figures as one shop's result, not a guarantee for yours.
Get Data Definitions Right Early
Agree on what counts as running, idle, setup, planned downtime, unplanned downtime, maintenance, waiting, and quality loss before collecting a single data point. Inconsistent definitions across shifts or plants make later comparisons meaningless.
Build Adoption and ROI Into the Plan
Operators need to understand why data is collected and how it supports improvement, not surveillance. That understanding affects how honestly downtime gets logged.
For ROI, skip invented numbers and use your own:
- Your machine-hour value
- Historical downtime hours
- Scrap cost
- Total implementation cost (software, connectivity, sensors, integration, training)
Weigh that against recovered productive time, reduced scrap, avoided emergency repairs, and deferred capital spending. One caveat: if your shop runs highly irregular, one-off work with no consistent job flow, broader scheduling or ERP problems may need solving first. Monitoring data is only as useful as the process it's measuring. Once definitions, adoption, and ROI baselines are in place, keep the same metrics after go-live so the pilot's lessons scale cleanly across the fleet.
How Vistrian Can Support CNC Machine Monitoring
Vistrian builds modular, cloud-enabled software for real-time visibility and analytics across the factory floor, plant, and enterprise levels. The platform draws on more than 25 years of hands-on manufacturing experience that began in semiconductor and data-storage environments.
FactoryLOOK and the broader Manufacturing Suite connect to machine controllers, logs, databases, standard protocols, and IIoT sensors—including older equipment that was never built with a digital interface in mind.
The right connection method depends on the specific machine, controller, network, and data required. Not every CNC controller or protocol is supported out of the box, and that's worth confirming during evaluation.
For CNC-oriented operations, relevant capabilities include:
- Equipment data acquisition from machines, PLCs, and sensors
- Live dashboards and configurable alerts
- Historian storage for trend analysis
- OEE, utilization, throughput, yield, and cycle-time reporting
- Root-cause investigation tools for downtime and quality events
At one cocoa and chocolate manufacturing facility, FactoryLOOK consolidated data that had been locked inside a SCADA system accessible only to engineering staff. That gave the wider team visibility for the first time.
The rollout pulled an average of 20 parameters per production tool at roughly one reading per second. It helped avoid more than $1 million in unnecessary capital spending by identifying a bottleneck before new equipment was purchased.
For operations leaders managing more than one plant, Vistrian Analytics and the Management Suite are built to compare performance across machines, lines, and sites, rather than leaving each plant to interpret its own numbers in isolation.
If you're weighing where CNC monitoring fits into your fleet, legacy equipment, and improvement goals, Vistrian's team can walk through a pilot scope with you based on your specific machines rather than a generic feature list.
Frequently Asked Questions
What is the best CNC machine monitoring software?
The best fit depends on machine compatibility, data depth, connectivity, analytics, integrations, and total cost. Run a pilot on your own equipment instead of choosing from a features checklist alone.
What is CNC an acronym for?
CNC stands for Computer Numerical Control. CNC machines use programmed digital instructions to control cutting, drilling, and other machining movements automatically.
What is the CNC process?
The typical sequence starts with a digital design, followed by generating a toolpath, loading the program, setting up the machine and workpiece, machining the part, and inspecting the finished result.
Can CNC machine monitoring systems work with older or legacy equipment?
Yes, though compatibility depends on the controller and available signals. Systems may connect through standard protocols, direct controller connections, machine logs, databases, gateways, or supplemental industrial IoT (IIoT) sensors.
What data does a CNC machine monitoring system collect?
Common data includes machine state, alarms, program or job information, part counts, cycle times, spindle or axis data, downtime reasons, and sensor measurements. Exact availability depends on the machine and how you connect it.