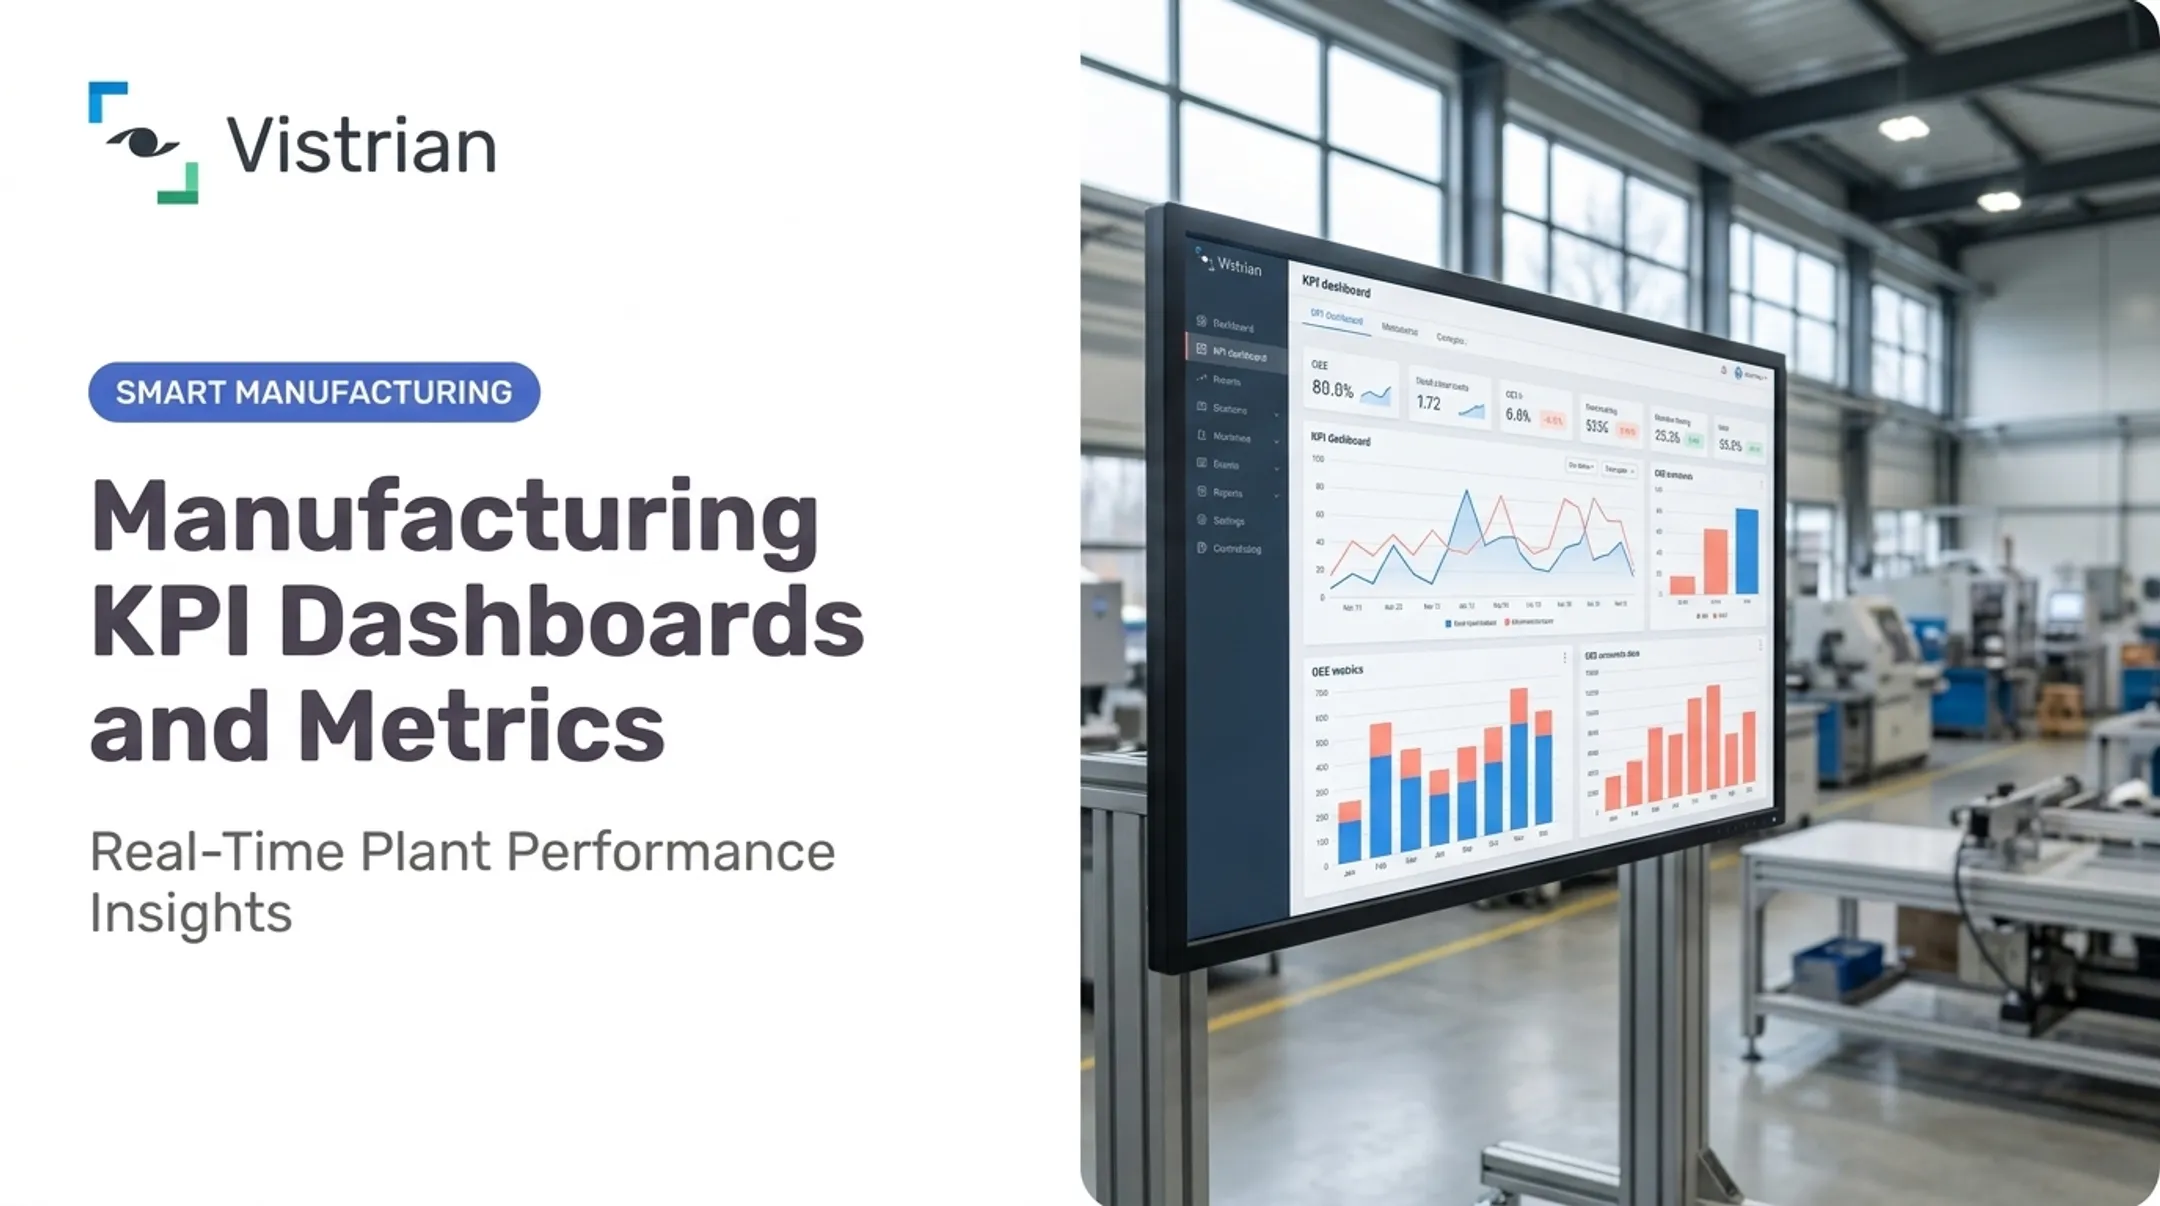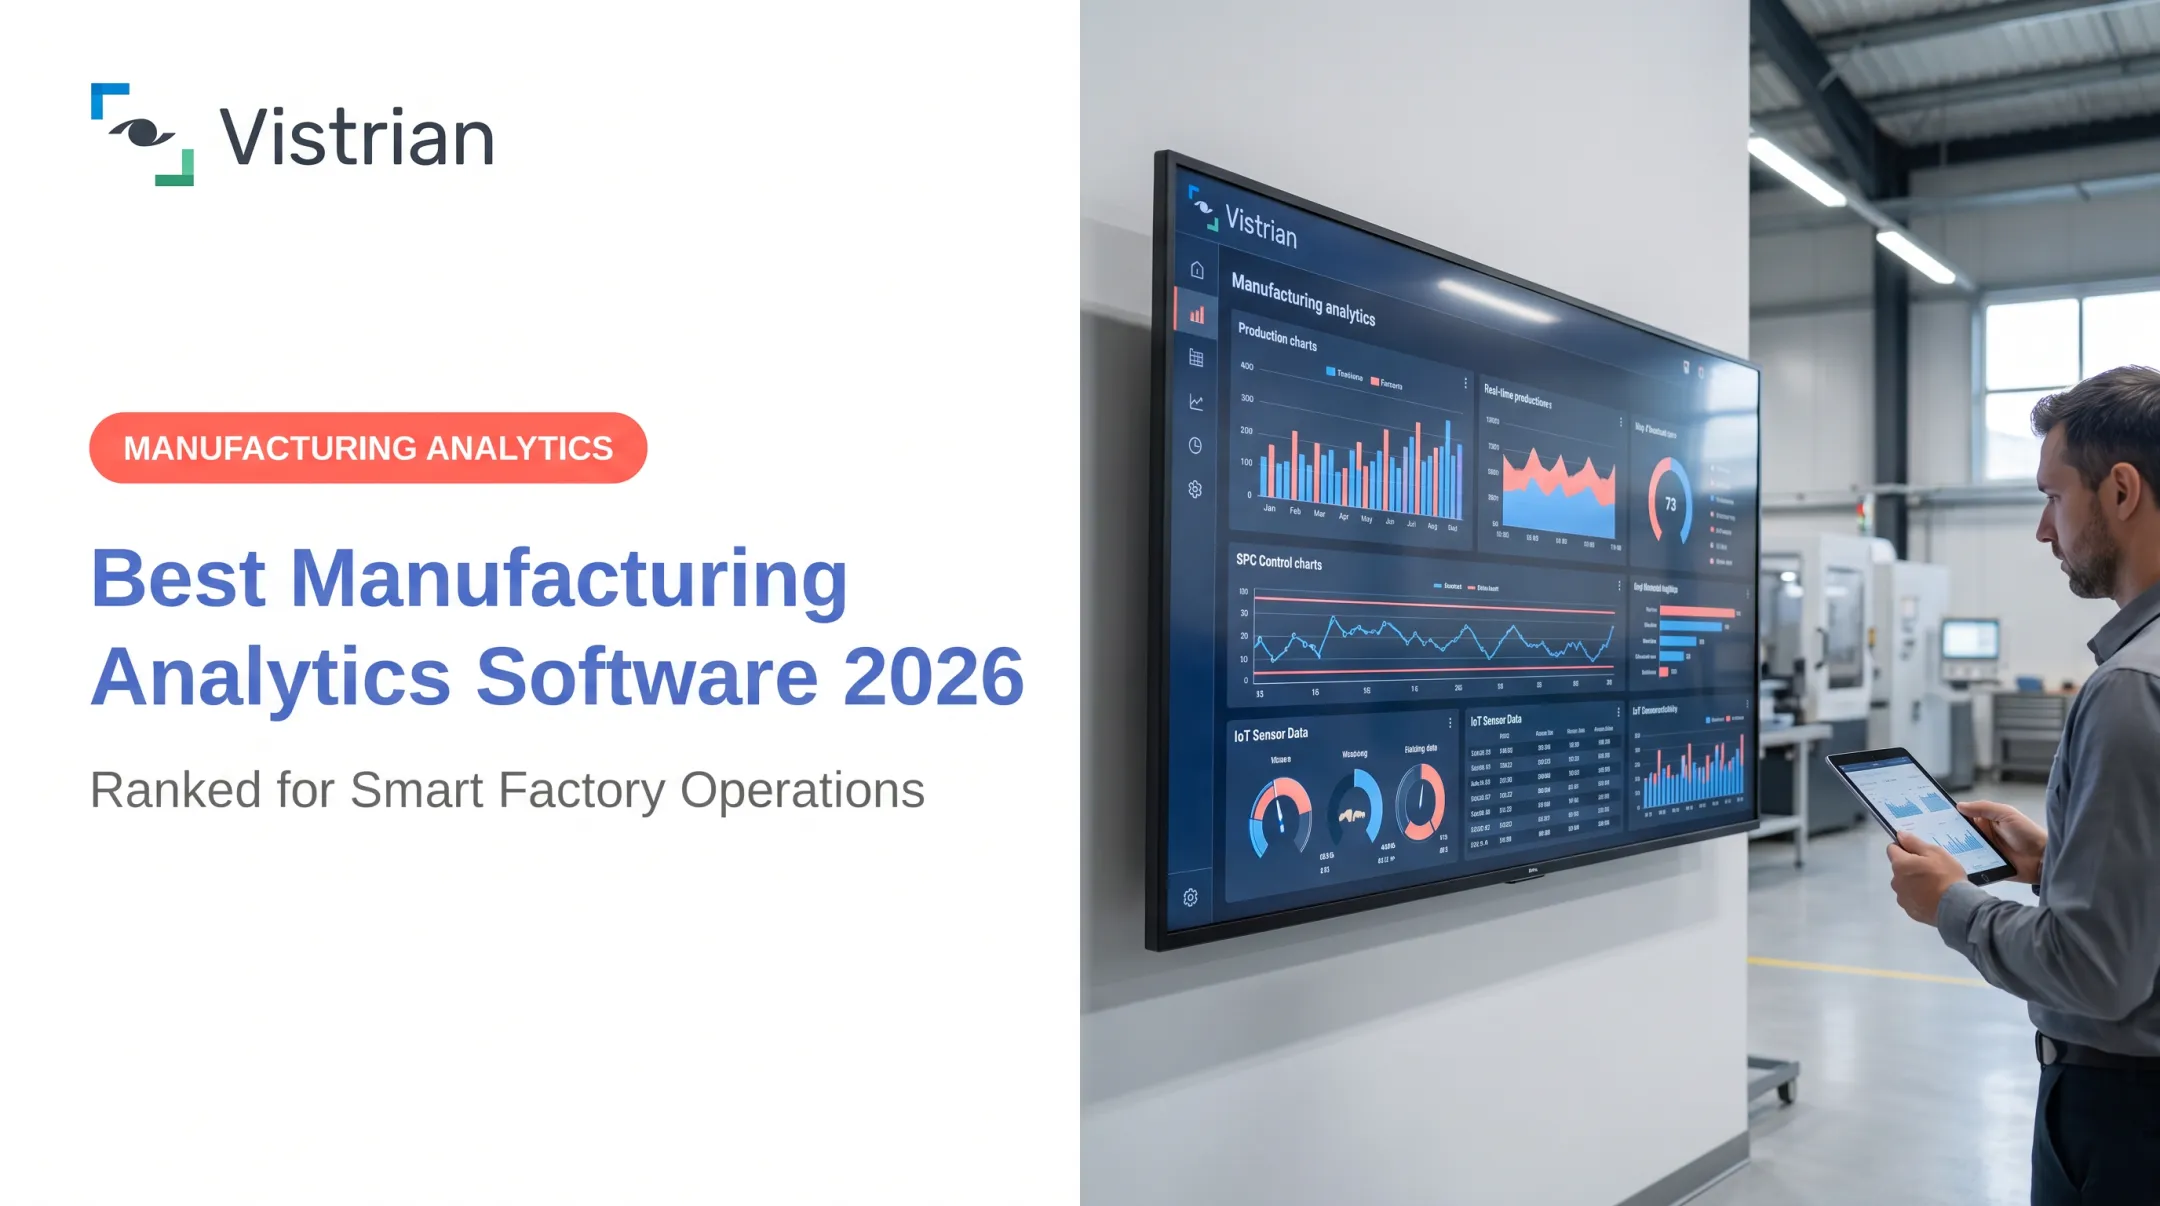

Manufacturers face a specific challenge here. Machine data lives in one system, production records in another, quality data somewhere else, and maintenance activity in a fourth place entirely. Stitching these together with spreadsheets and manual updates creates delays exactly when you need speed.
This guide compares five dashboard platforms, starting with Vistrian's manufacturing-focused approach. We'll evaluate each against connectivity, real-time monitoring, usability, analytics depth, governance, scalability, and total cost of ownership.
Key Takeaways
- Dashboard software spans simple KPI displays to full BI platforms with data modeling, governance, and embedded reporting
- Manufacturing buyers should prioritize machine connectivity, legacy equipment support, OEE tracking, and multi-plant visibility
- General BI platforms like Power BI, Tableau, Domo, and Qlik Sense fit enterprise analytics but require connectivity verification
- Specialized platforms like Vistrian fit manufacturers that need near-real-time equipment visibility and plant-to-enterprise reporting
Overview of Dashboard Software in the US Manufacturing Market
Dashboard software collects, organizes, and visualizes data through charts, scorecards, trends, and alerts. That sets it apart from a spreadsheet (static, manually updated) or a scheduled reporting tool (periodic snapshots, not interactive). It is also narrower than a full BI platform, which adds data modeling, governance, and embedded analytics on top of dashboards.
For manufacturers, dashboards translate directly into floor-level decisions:
- Equipment status — is the machine running, idle, or down right now?
- Downtime and throughput — where is production losing time today?
- Yield and quality indicators — are defect rates trending up on this shift?
- OEE — how is overall equipment effectiveness tracking against target?
These views need to work at three levels simultaneously: plant-floor (operators reacting in the moment), site (supervisors managing a shift), and enterprise (executives comparing plants).
Adoption of the underlying technology is already mainstream. Deloitte's 2025 Smart Manufacturing Survey found that 57% of US manufacturers use cloud computing, 57% use data analytics, and 46% use industrial IoT at the facility or network level. Most plants already run in a mixed cloud, analytics, and OT environment. Dashboard software has to fit that mix—not force a rebuild around it.

The five platforms below cover different jobs: manufacturing operations, enterprise BI, self-service analysis, and embedded reporting. Use the comparison to match the tool to the decision layer you need first.
Top Dashboard Software Solutions for Manufacturing and Business Operations
Before comparing features, define your criteria:
- Manufacturing fit and data-source connectivity
- Dashboard usability and refresh speed
- Analytics depth and alerting
- Security, scalability, and implementation effort
A platform that scores well on paper but can't talk to your PLCs isn't a fit.
Vistrian Manufacturing Suite and FactoryLOOK
Vistrian is a modular, cloud-enabled smart manufacturing platform. It combines equipment data acquisition, IIoT connectivity, e-Recording, historian storage, analytics, statistical process control (SPC), reporting, dashboards, and alerts in one suite.
What sets it apart for manufacturers is FactoryLOOK, the connectivity layer underneath the dashboards. It connects to PLCs and PC-based systems through standard industrial protocols. When direct integration isn't possible, it pulls data from logs or databases instead. For machines with no digital interface at all, Vistrian's IoT layer adds sensors and syncs that data back into FactoryLOOK.
That matters because most US plants aren't running all-new equipment. A dashboard platform that only works with modern controllers leaves gaps on the floor. FactoryLOOK's rules engine also flags anomalies and threshold breaches as they happen, not after a shift report gets compiled.
One customer example: a North American cocoa processor used FactoryLOOK to get continuous, human-input-free OEE visibility. The data revealed the actual bottleneck wasn't the refiners everyone suspected — it was plumbing between the refiners and holding tanks. That finding avoided over $1 million in unnecessary capital spending on equipment that wasn't the problem.
| Category | Details |
|---|---|
| Manufacturing focus | Purpose-built for discrete and process manufacturing; not a general BI tool |
| Core capabilities | Data acquisition, IIoT, historian, SPC, analytics, multi-screen dashboards, alerts |
| Connectivity | PLCs, standard protocols, logs, databases, IIoT sensors, legacy equipment |
| Deployment | Cloud or on-premises; web browser and mobile access |
| Best-fit users | Manufacturers needing plant-floor to enterprise visibility without heavy data engineering |
Power BI
Microsoft Power BI is a broad BI and dashboard platform built for self-service reporting, interactive visualizations, and data modeling. It fits organizations already invested in the Microsoft ecosystem.
Pricing is public and straightforward: Power BI Pro runs $14 per user per month, billed annually, while Premium Per User runs $24 per user per month with larger model sizes and more frequent refreshes.
For manufacturers already using Microsoft 365, Azure, SQL Server, or Dynamics, Power BI can pull production, sales, and QA data with less integration friction. Microsoft even publishes an OPC UA reference architecture for connecting industrial data sources to Power BI. Sandvik Coromant used Azure and Power BI to replace legacy reporting tools, according to a Microsoft customer story published in 2023.
The catch: complex data models, DAX formulas, and governance setup often need a dedicated analyst or Microsoft partner. Native industrial connectivity beyond Azure sources typically requires custom architecture work.
| Category | Details |
|---|---|
| Manufacturing use-case fit | Strong if already on Microsoft stack; requires integration work otherwise |
| Data preparation | Excel, SQL, Azure sources native; industrial protocols need custom setup |
| Governance | Tied to Fabric/Premium capacity licensing model |
| Best-fit organization | Microsoft-centric enterprises with in-house data skills |
Tableau
Tableau is a visual analytics platform built for analysts who need flexible exploration and presentation-quality dashboards. Standard pricing lists at $15 per user per month, billed annually, with Creator, Explorer, and Viewer role tiers.
It can help manufacturing teams analyze production, quality, and supply chain data — but only after those sources are connected and modeled. Tableau documents 60+ native connectors plus SAP integration for S/4HANA and Business Warehouse data.
Oldcastle, a building-products manufacturer with 206 facilities and 78,000 SKUs, uses Tableau with nightly refreshes and row-level security across thousands of users.
For plant-floor buyers, though, the learning curve is real. Tableau depends on upstream data engineering; it doesn't natively speak to controllers, historians, or MES systems. You'll need to verify partner connectors for that layer before assuming it fits.
| Category | Details |
|---|---|
| Visualization depth | Strong; built for exploratory, presentation-grade dashboards |
| Manufacturing integration | Requires data engineering; no native industrial protocol support |
| Governance | Tableau Catalog, Prep Conductor, encryption at rest |
| Best-fit users | Analyst teams with existing data pipelines, not plant-floor operators |
Domo
Domo is a cloud-based platform combining data integration, dashboards, collaboration, and alerts for organizations wanting a broader operational and executive view.
Its integration story is its strongest feature: 1,000+ pre-built connectors spanning on-premises, cloud, and edge data, plus batch, micro-batch, and streaming pipeline options. Domo Mobile delivers dashboards and KPIs on iOS and Android, and Domo Embed supports embedded analytics for external users.
Secil, a Portugal-based cement and concrete producer, connected corporate systems with factory operations through Domo — ingesting over 1 billion rows and adding 20 data sources in its first year.
Pricing runs on a credit-consumption model tied to actions like data storage and pipeline runs, rather than flat per-user fees. That makes cost forecasting trickier without a usage estimate up front. Before committing, confirm exactly how your manufacturing data sources — PLCs, historians, MES — connect, since Domo's connector list leans heavily toward business and cloud applications.
| Category | Details |
|---|---|
| Cross-functional coverage | Strong for finance, supply chain, sales, ops combined |
| Data integration | 1,000+ connectors; verify industrial protocol support directly |
| AI/governance | Built-in governance tools, trusted AI controls |
| Best-fit organization | Multi-department enterprises consolidating varied data types |
Qlik Sense
Qlik Sense runs on an associative analytics engine, letting users select, search, and drill across related and unrelated data without pre-defined query paths. That's a genuinely different exploration model than most dashboard tools.
Manufacturers could use it to explore relationships between equipment events, output, quality results, and maintenance records — provided the underlying data architecture is prepared first. Qlik offers both Qlik Cloud Analytics (SaaS) and Qlik Sense (client-managed, on-premises) for regulated environments.
Published starting pricing: $300 per month for 10 users, or capacity-based plans starting at $825/month for 25GB, billed annually.
Georgia-Pacific reports saving 30,000 hours per year using Qlik Sense's customized dashboards, with 85% regular platform access among users.
Implementation considerations matter here: data modeling, user training, and governance setup take real effort before plant-floor systems or historians can feed clean data into the associative model.
| Category | Details |
|---|---|
| Exploratory analytics | Strong; associative engine supports non-linear data exploration |
| Data preparation | Significant upfront modeling required for industrial data |
| Security/deployment | Cloud SaaS or on-premises; MFA, IP allowlists, governed catalog |
| Best-fit users | Organizations with analyst resources for governed self-service |

How We Chose the Best Dashboard Software
The right evaluation focuses on operational fit and measurable outcomes, not the longest feature list. Start by identifying who will use the dashboard, what decisions it drives, and how fast a response needs to happen.
Manufacturing connectivity comes first. Confirm support for:
- PLCs, controllers, and historians
- Databases, MES, and ERP systems
- IIoT sensors and standard industrial protocols
- Legacy equipment lacking digital interfaces
- APIs for custom integration where needed
Then check whether third-party middleware is required to bridge any gaps. That adds cost and complexity most vendor pricing pages don't mention.
Dashboard usefulness is the next filter. Can users actually monitor OEE, downtime, throughput, yield, and quality through role-specific views? A dashboard built for executives won't help an operator responding to a stopped line.
Data freshness determines actionability. Streaming and near-real-time data support immediate response. Scheduled or historical data supports trend analysis but not floor-level intervention. Know which one your use case actually needs. Not every KPI requires second-by-second refresh.
Implementation and ownership costs add up beyond the license fee. Factor in:
- Data preparation and integration effort
- User training time
- Role-based access and security setup
- Multi-plant administration overhead
- Infrastructure and support costs
Third-party reviews add useful context once the operational filters are clear. On G2, Power BI holds a 4.5/5 rating across 1,658 reviews, Tableau sits at 4.4/5 with 3,787 reviews, and Qlik Sense holds 4.4/5 with 929 reviews. These scores reflect user satisfaction, not OEE or throughput benchmarks, so treat them as one input among several.
Conclusion
The best dashboard software depends on the decisions your organization needs to make, how fresh your data needs to be, and whether you're solving for operational monitoring, enterprise BI, or both.
Before committing to any platform, test it against your actual environment:
- Connect it to a representative machine or system and confirm data flows correctly
- Validate KPI definitions like OEE and downtime match how your team already calculates them
- Confirm the platform scales from one plant to multiple sites without a redesign
If manufacturing-specific visibility is the priority, Vistrian is worth assessing directly. That means equipment and process data, IIoT connectivity, and reporting that runs from plant floor to enterprise dashboard. Talk through those operational visibility requirements before choosing a platform built for a different problem.
Frequently Asked Questions
What is dashboard software?
Dashboard software transforms raw data into visual KPI displays, charts, alerts, and interactive reports. Unlike a spreadsheet, it updates automatically; unlike a full BI platform, it typically skips deep data modeling and governance layers.
What are the four types of dashboards?
The four types are strategic (long-term executive goals), tactical (departmental KPIs), operational (real-time frontline metrics), and analytical (deep analysis of large data volumes).
What is the 5-second rule for dashboards?
A viewer should grasp the dashboard's main message or priority within about five seconds. That requires clear visual hierarchy, minimal clutter, readable labels, and exceptions that stand out immediately.
What is a manufacturing dashboard?
A manufacturing dashboard monitors production, equipment, quality, and maintenance metrics such as downtime, throughput, yield, utilization, and OEE — typically at machine, line, plant, or enterprise level.
How do I choose the best dashboard software?
Evaluate data sources, refresh requirements, intended users, and integration needs first. Then assess ease of use, governance, scalability, security, implementation effort, and total cost of ownership before comparing prices.
Can dashboard software connect to machines and legacy manufacturing equipment?
Capability varies by platform. Confirm support for controllers, standard protocols, databases, logs, historians, and IIoT sensors, and whether gateways or middleware are needed for older equipment.