
Introduction
A production plan is only as good as the visibility behind it. The moment a machine goes down, a supervisor doesn't hear about it, or quality data trickles in hours late, that plan starts drifting from reality.
Manufacturers are investing heavily to close that visibility gap. In a 2025 Deloitte survey of 600 manufacturing executives, 57% reported using cloud computing and data analytics at the facility level. Companies that did so reported average production output gains of 10% to 20%.
Production planning sets the target: what to make, how much, and with which resources. Manufacturing dashboards show whether the floor is actually hitting that target. This article covers the five steps of production planning, the dashboard types that support them, the KPIs worth tracking, and how to build a dashboard teams actually use.
Key Takeaways
- Production planning turns demand, materials, labor, and equipment into a schedule you can run and measure.
- Dashboards close the loop by comparing planned output to actual production, downtime, and quality.
- Role-specific views on a few validated KPIs let teams drill from plant metrics to root causes.
- Pilot one line or process, validate the data, then expand.
Production Planning and Manufacturing Dashboards: How They Work Together
Production planning decides what to make, how much, when, and which resources it takes to get there.
According to the ASCM/APICS manufacturing planning and control framework, this is a closed-loop process: sales and operations planning sets the demand picture, master production scheduling turns it into a build plan, and capacity requirements planning checks whether resources can support it.
Execution is a different discipline. It starts once the plan is accepted as realistic, and it covers detailed scheduling, dispatching, and delay reporting on the shop floor.
Planners set the targets and constraints. Dashboards show what's actually happening against those targets. Supervisors use the exceptions on the dashboard to reprioritize work, shift labor, or escalate a maintenance issue before it derails the shift.
A planning board and a dashboard aren't the same tool, though they're often confused:
| Dimension | Production Planning Board | Manufacturing Dashboard |
|---|---|---|
| Focus | Jobs, sequence, dependencies | Aggregated performance, trends |
| Time view | Forward-looking (what's next) | Live and historical (what happened) |
| Primary user | Planners, schedulers | Supervisors, plant managers, planners |
| Typical output | Work-center assignments, due dates | KPI status, exceptions, alerts |
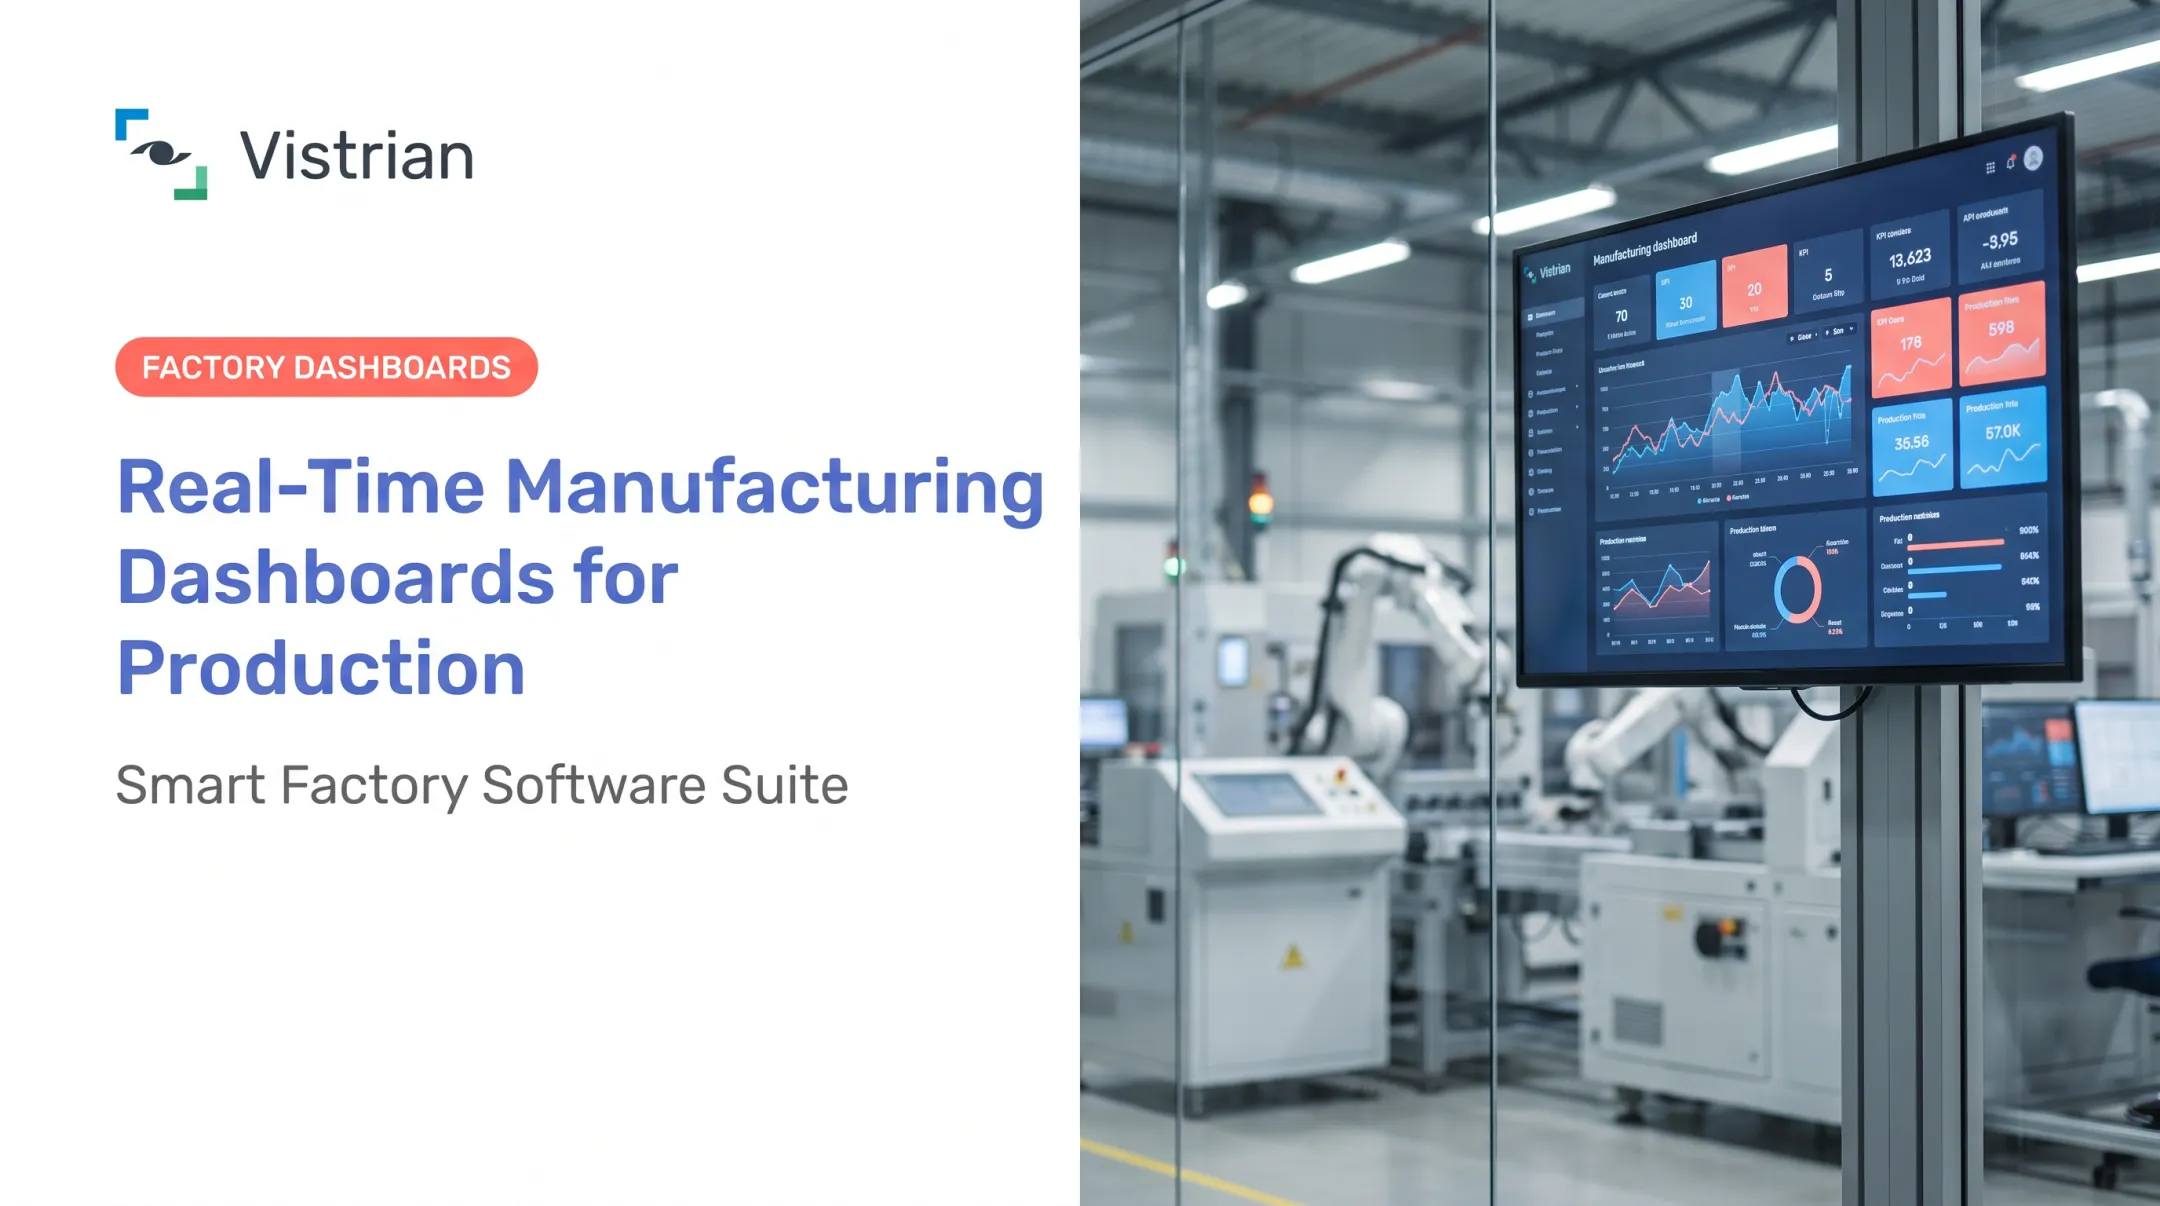
Vistrian's Manufacturing Suite is built around this handoff. FactoryLOOK captures machine, sensor, and production data continuously. Vistrian Dashboards turns that stream into near-real-time visibility at the machine, line, plant, or enterprise level—so planning assumptions get tested against what's actually happening on the floor.
The 5 Steps of Production Planning
Define Demand, Production Objectives, and Planning Horizons
Everything starts with demand. Customer orders, sales forecasts, inventory policy, and delivery commitments all feed into a production target. Product mix and required service levels matter too.
Example: A supplier needs 10,000 units delivered in six weeks, current inventory covers 2,000, and safety stock policy requires holding 500 more. The production target becomes 8,500 units against a six-week horizon, not the raw order quantity.
Check Materials, Labor, Equipment, and Capacity Constraints
A plan built on demand alone isn't a plan. It's a wish list. Before committing to numbers, planners need to validate:
- Bill of materials and raw material availability
- Staffing levels and shift coverage
- Machine capability and required tooling
- Maintenance windows and planned downtime
- Bottleneck capacity at the constraining work center
If a critical machine is booked for calibration during week four, the plan needs to account for it now, not discover it later.
Create the Master Production Plan and Sequence Work
With demand and constraints defined, planners translate both into production quantities, due dates, and work-center assignments. This master production plan sits above the detailed schedule supervisors use daily. It typically locks in:
- Production quantities by SKU or product family
- Due dates tied to the planning horizon
- Work-center or line assignments
The master plan says "500 units of Product A by Friday." The shift schedule decides which machine runs first and in what order.
Execute the Plan and Monitor Actual Performance
Execution is where the plan meets reality. Teams need visibility into:
- Actual output versus planned output
- Cycle time and takt-time adherence
- Downtime events and duration
- Work-in-process (WIP) levels
- Quality results by order or batch
Dashboard alerts matter most here. A deviation caught two hours into a shift is fixable. The same deviation discovered at shift-end is a lost day.
Review Results, Resolve Causes, and Replan
This isn't a one-time report-out. It's a recurring cycle. Teams review variances, dig into root causes, and feed what they learn back into the next planning round. ASQ's PDCA framework describes this well: plan a change, test it, check the results, then act on what was learned. That may mean standardizing a fix or trying again.
Historical dashboard trends make this step useful instead of theoretical. Without a data trail, "we think the paint line is the bottleneck" stays a guess. With one, teams replan from measured causes instead of opinions.

Types of Manufacturing Dashboards for Production Planning and Execution
Different roles need different views. A single dashboard trying to serve everyone usually serves no one well.
Operational or Plant Overview Dashboard
This is the control-tower view for plant managers. It typically surfaces:
- Line status and output versus plan
- Active exceptions and major downtime events
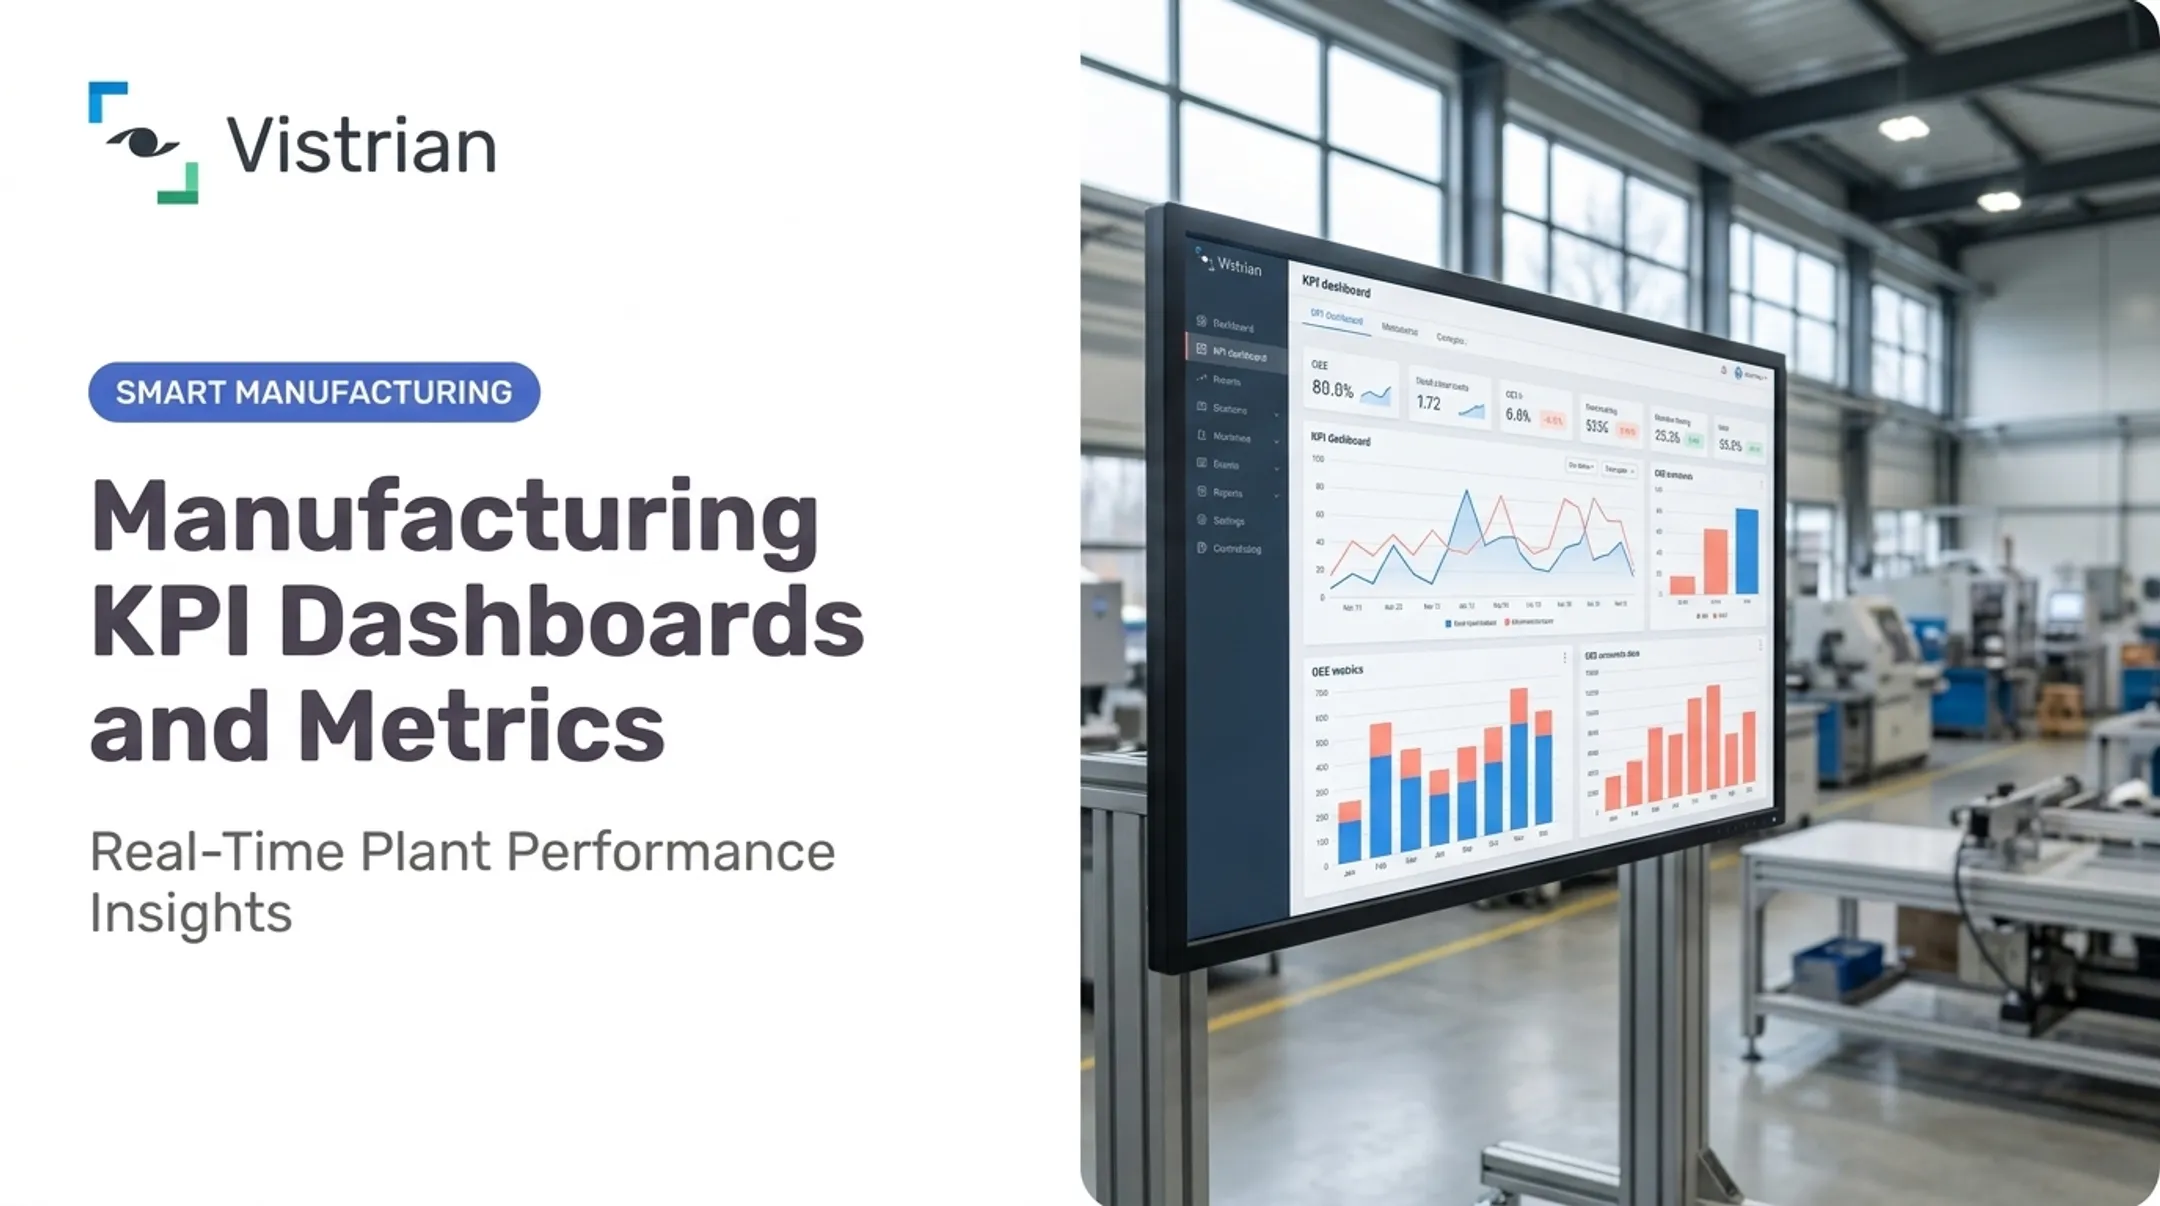
- Overall equipment effectiveness (OEE)
If a plant runs multiple lines or sites, the same view should support side-by-side comparison.
Production Performance and Schedule Adherence Dashboard
Built for planners and supervisors, this view tracks:
- Planned versus actual production
- Order status and due dates
- Throughput, cycle time, and WIP
It's the fastest way to see where a bottleneck is forming before it delays a shipment.
OEE, Machine Utilization, and Downtime Dashboard
OEE is calculated as Availability × Performance × Quality, according to Vorne's OEE reference. The combined score is useful for a quick health check, but it hides the actual problem.
Why the components matter more than the score:
- Availability drops usually mean downtime or long changeovers
- Performance gaps point to speed loss against ideal cycle time
- Quality shortfalls show up as scrap or rework
Vistrian's Manufacturing Suite illustrated this in a disk-media production pilot, where FactoryLOOK tracked roughly 20 parameters per tool at two to five readings per second. It flagged an ultrasonic generator briefly drawing four times its expected power on every cycle, an anomaly the combined OEE number alone would never have surfaced.
The event-trend charts showed a direct correlation between that spike and yield loss.
Quality and Process Dashboard
This view typically covers:
- First-pass yield
- Scrap, rework, and defect categories
- Quality holds
Connecting quality data to specific production orders lets teams see which products, machines, materials, or shifts drive deviations, rather than guessing.
Maintenance, Capacity, and Resource Dashboard
Preventive maintenance schedules, equipment availability, open work orders, and spare-parts status all affect what planners can realistically schedule. This view helps avoid the common mistake of assigning work to a machine that's about to go down for service.

How to Build and Use a Production Planning Dashboard
Start With Decisions, Users, and Measurable Objectives
Before picking metrics, identify the decisions the dashboard needs to support:
- Responding to unplanned downtime
- Reallocating labor or work
- Protecting a delivery date
- Managing a quality hold
- Balancing capacity across lines
Then map separate views to each role:
- Operators
- Supervisors
- Planners
- Quality teams
- Maintenance teams
- Executives
An operator screen crowded with capacity-utilization trends isn't useful mid-shift. An executive dashboard buried in machine-level fault codes isn't either.
Select a Focused KPI Set and Define Each Metric Consistently
Start small. A workable starting set:
- Planned versus actual output
- Schedule adherence
- Throughput and cycle time
- WIP
- Downtime and OEE
- First-pass yield and scrap
- Utilization
- On-time delivery
Every metric needs a documented formula, a data owner, a target, a time period, and an escalation rule. Without it, two teams will report different numbers for the same shift—and trust erodes fast.
Connect Machine, Production, Quality, Maintenance, and Business Data
Reliable dashboards depend on reliable sourcing. Common inputs include PLCs, CNC controllers, legacy machine interfaces, IIoT sensors, MES, ERP, quality systems, and maintenance records. Consistent equipment IDs, part numbers, order numbers, and downtime codes across these systems are non-negotiable. Without them, a dashboard just aggregates noise.
Vistrian's Manufacturing Suite, through FactoryLOOK, collects near-real-time data from machine controllers, logs, databases, and IIoT devices—including equipment that predates any modern digital interface.
That matters for plants running a mix of decade-old CNC machines and newer connected tools, which is most plants.
Design for Glanceability, Action, and Investigation
Dashboard design researcher Stephen Few's work on at-a-glance monitoring emphasizes that a user should grasp a dashboard's purpose and current status almost immediately. Industry teams often call this the "5 second rule," though it is a design principle rather than a formal standard.
In practice, that means:
- Visual hierarchy with the most urgent exception front and center
- Restrained color coding (not every metric needs red/yellow/green)
- Trend lines instead of raw tables where possible
- Drill-down paths from plant-level variance down to shift, machine, or downtime reason
A user should be able to move from "what happened" to "why" to "what to do next" without leaving the screen.
Pilot, Validate, and Establish a Review Routine
Don't roll dashboards out plant-wide on day one. Pilot one line or one planning process. Reconcile the numbers against trusted production records. Validate every KPI formula. Document data-quality issues before scaling further.
Then build the routine around it:
- Shift-start review of overnight exceptions
- Mid-shift check on active alerts
- Daily production meeting using yesterday's variance data
- Weekly capacity review
- Monthly trend analysis for continuous improvement

Vistrian Analytics supports this stage by tracking OEE, throughput, utilization, yield, and cycle time with root-cause analysis. Teams get a consistent basis for recurring reviews instead of pulling one-off reports each time.
Conclusion
Planning and dashboards aren't competing tools. One creates the intended path, the other shows where reality is diverging from it. Neither works well without the other.
The practical starting point is narrow:
- Pick a small number of business-critical decisions
- Validate a handful of KPIs
- Connect the data sources that actually feed those decisions
- Pilot before scaling
Plants that skip straight to enterprise-wide dashboards without this groundwork usually end up with numbers nobody trusts.
Frequently Asked Questions
What are the 5 steps of production planning?
The five steps are: define demand and objectives, check material and capacity constraints, build the master production plan, execute while monitoring performance, and review results to replan. Each step feeds the next in a continuous cycle.
What is the 5 second rule for dashboards?
Users should grasp a dashboard's purpose and current status within about five seconds. It's a widely used design heuristic, not a formal standard.
What are the four types of dashboards?
Common categories include operational, tactical, analytical, and strategic dashboards. Some frameworks fold tactical and analytical into one category for periodic trend analysis.
What KPIs should be included in a production planning dashboard?
Start with planned versus actual output, schedule adherence, throughput, cycle time, WIP, downtime, OEE, first-pass yield, and on-time delivery. Prioritize a small set of actionable metrics over a long list nobody checks.
How do manufacturing dashboards support production planning?
Dashboards compare the plan against live execution data, exposing bottlenecks and constraints as they happen. They support faster escalation and give planners historical evidence to improve the next planning cycle.
Can manufacturing dashboards work with legacy machines?
Yes. Legacy equipment can connect through existing controllers, logs, databases, standard protocols, or retrofit IIoT sensors where a digital interface doesn't exist. Validate data accuracy and security before full deployment.