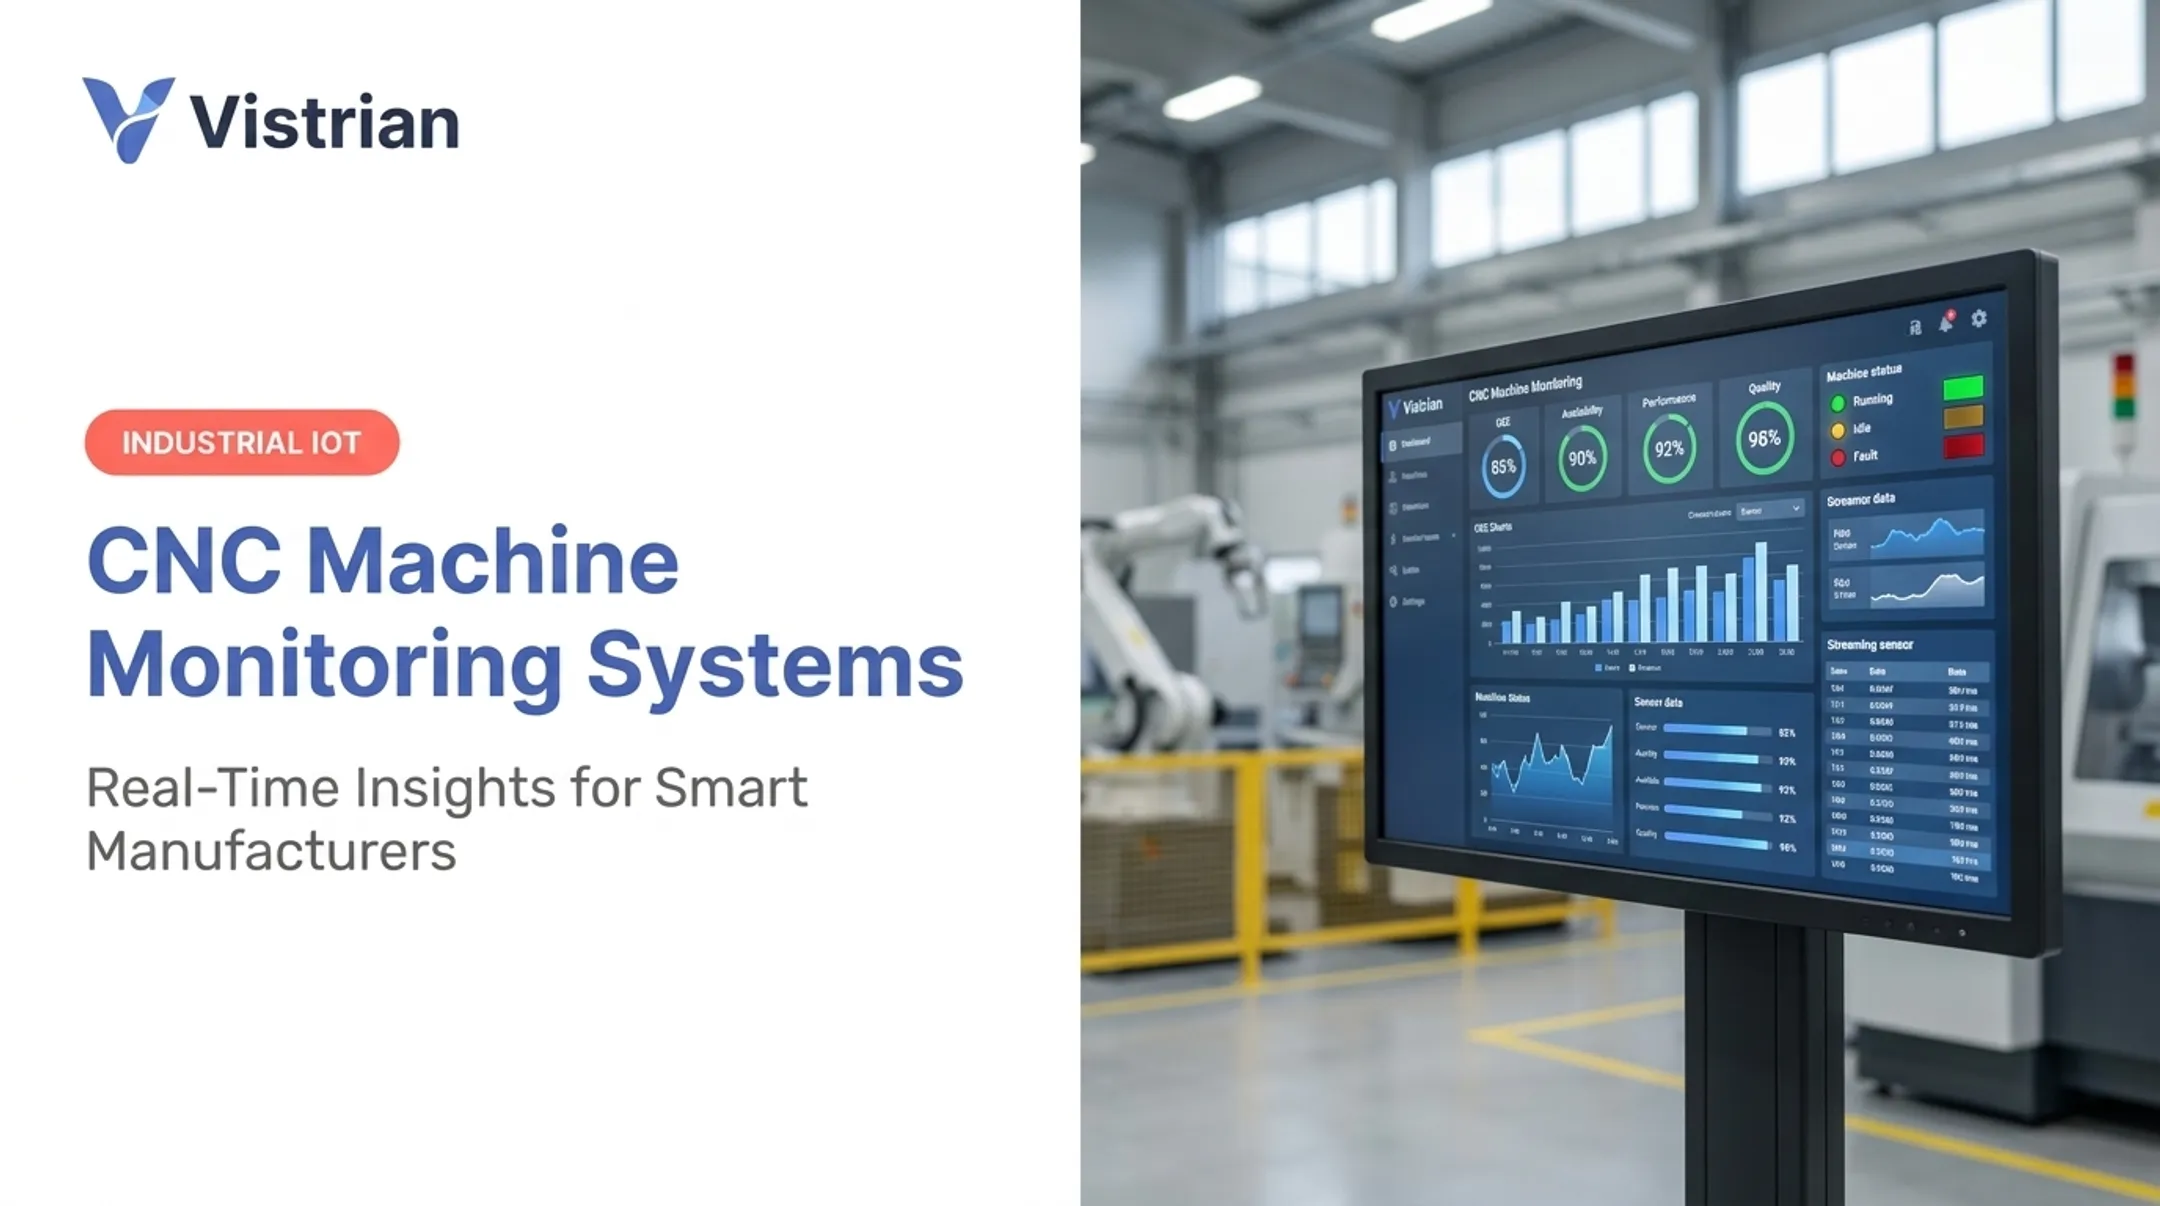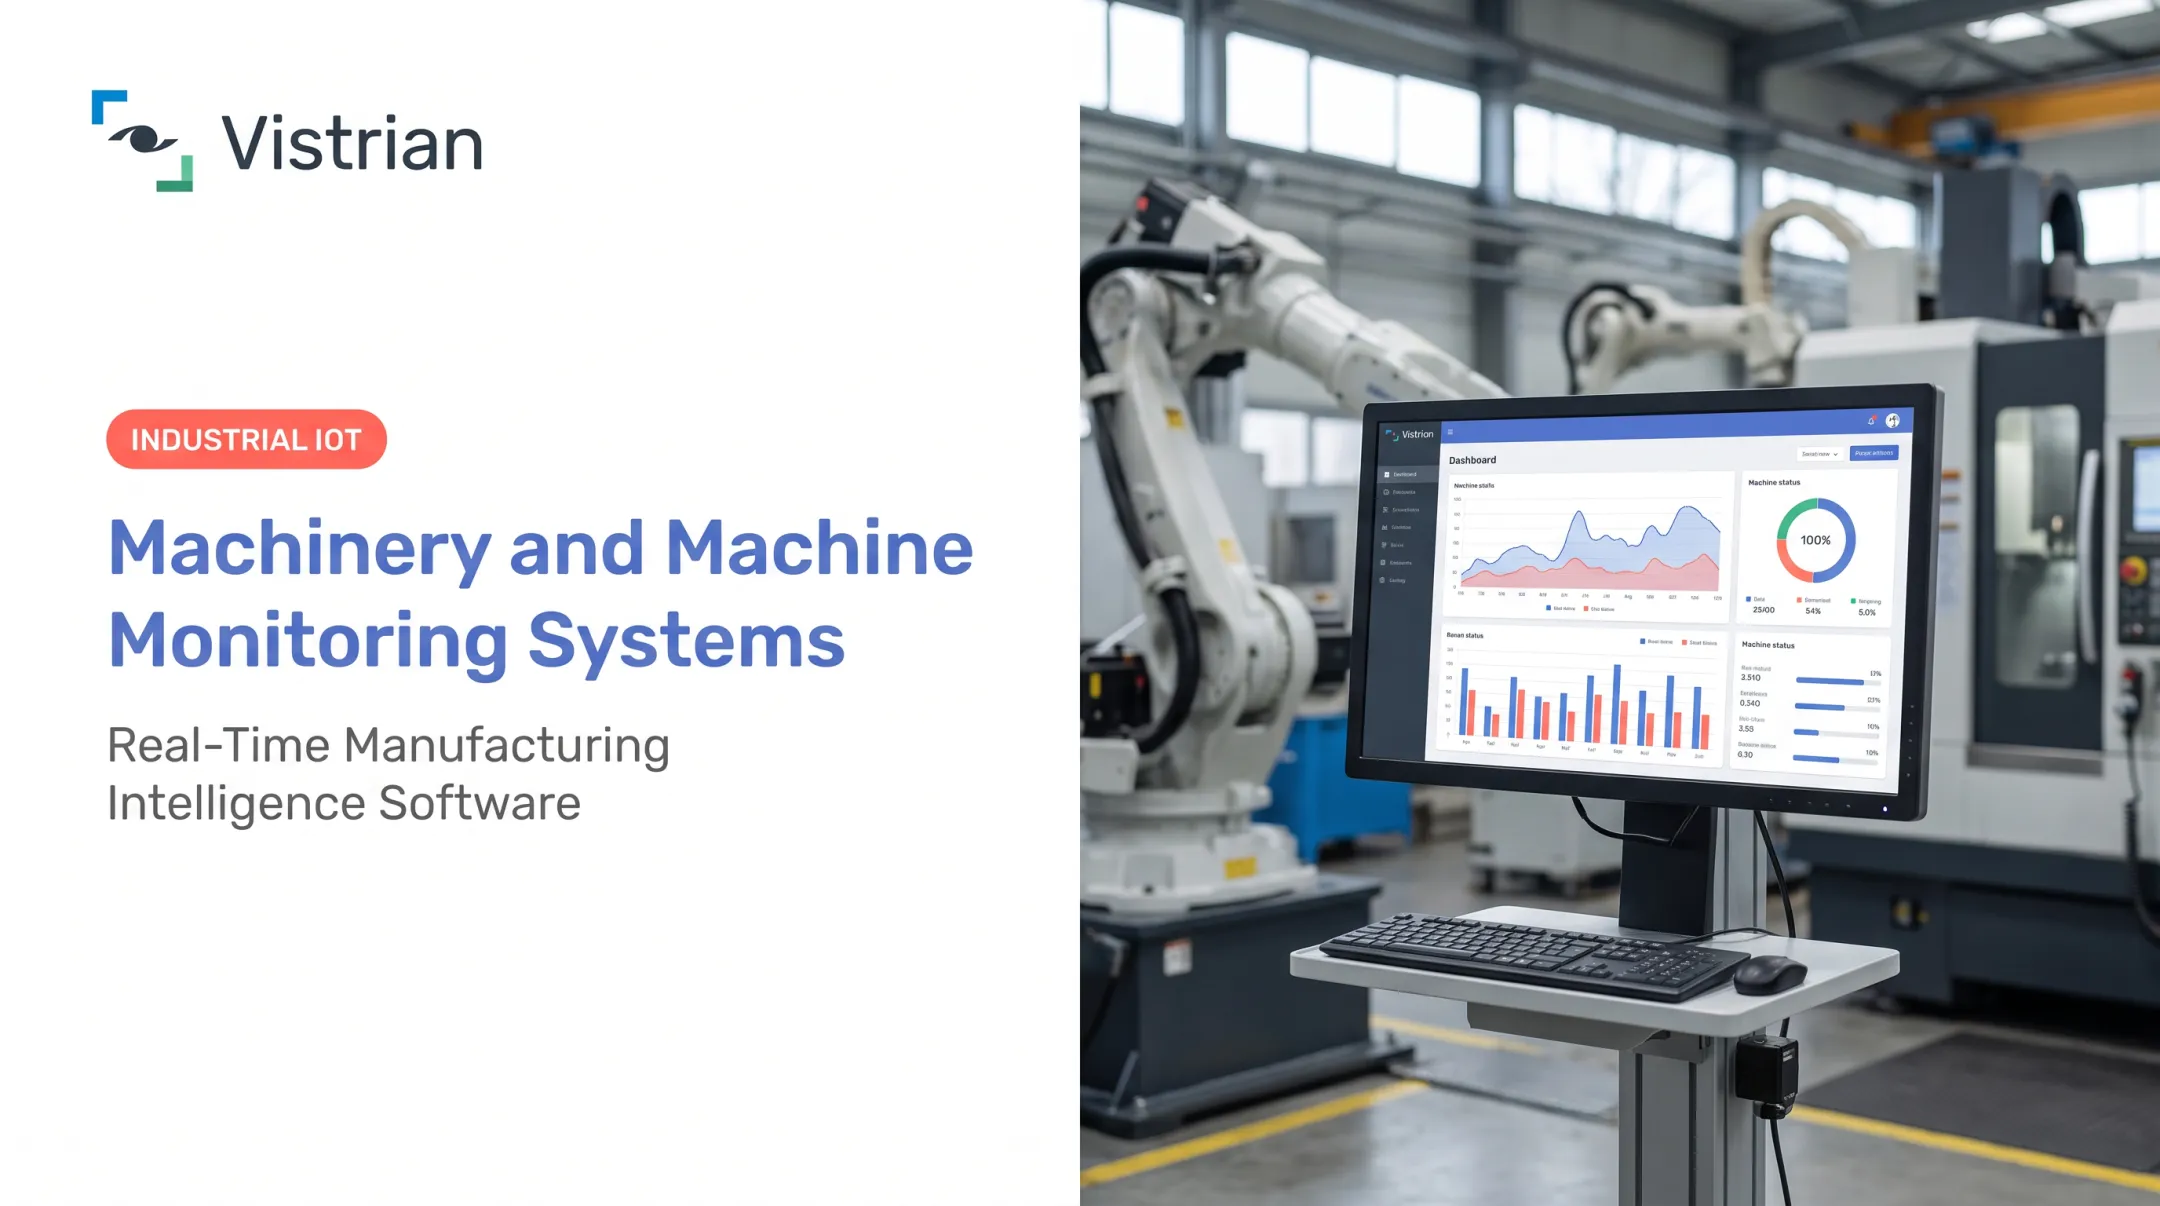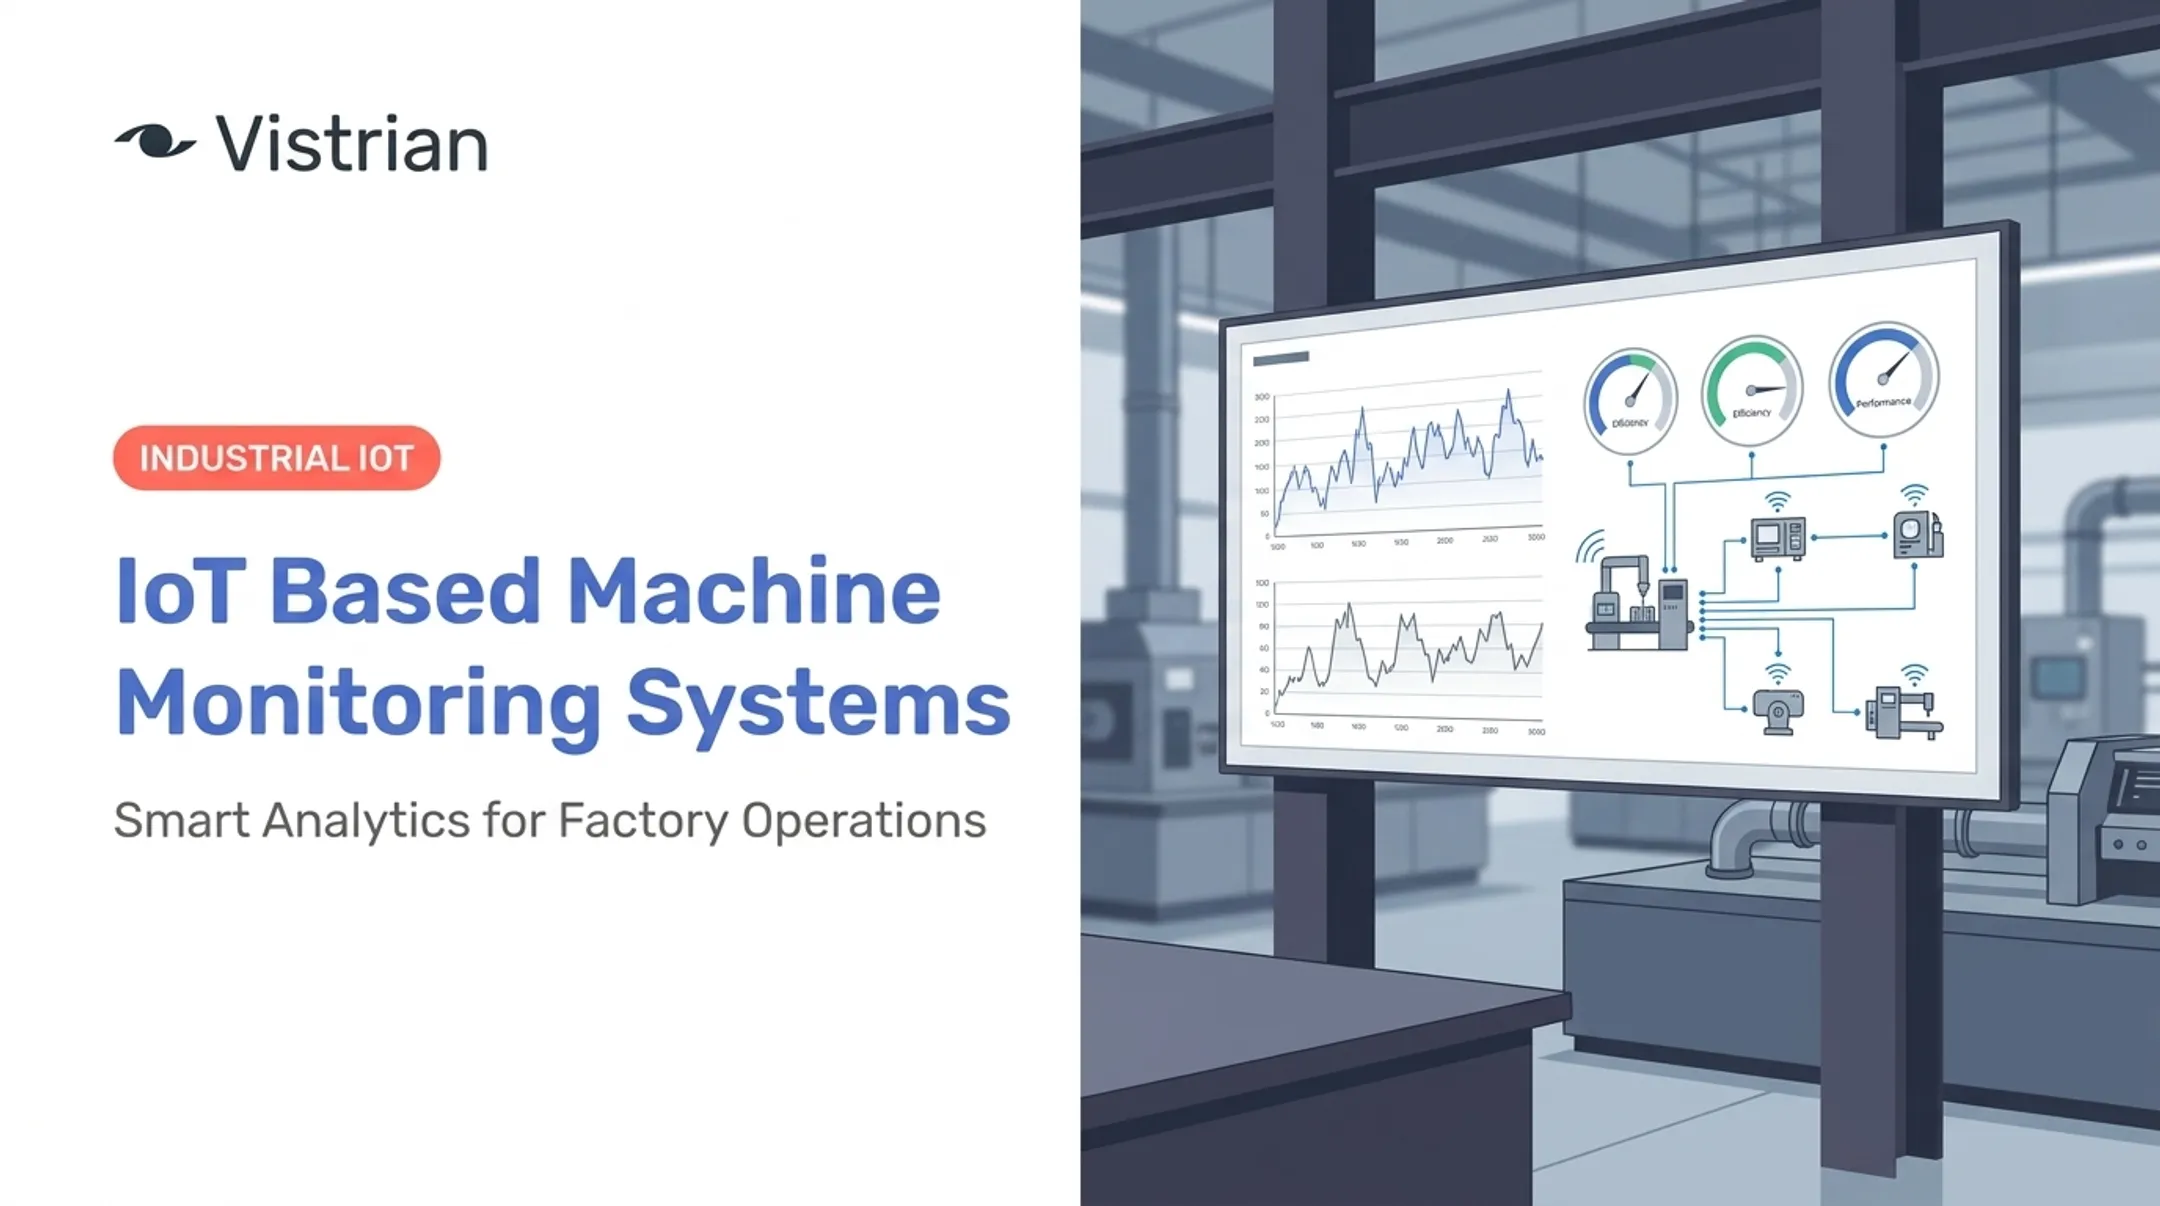

Introduction: Machine Monitoring Software for Modern Manufacturers
Machine monitoring software collects, contextualizes, and analyzes equipment data so production, maintenance, and management teams get actionable visibility instead of guesswork. It turns raw signals from controllers, PLCs, and sensors into dashboards, alerts, and reports that people can actually use.
Many manufacturers still struggle with the basics:
- Spreadsheet-based reporting that lags the floor
- Downtime details that arrive hours late
- Underused equipment and inconsistent cycle times
- Maintenance that only happens after something breaks
The numbers back this up. 70% of manufacturers still enter production data manually, according to the Manufacturing Leadership Council.
A 2025 Fluke survey found that 55% of US manufacturers experienced unplanned downtime in the prior year, with some facilities losing an average of $400,000 per hour.
This guide covers how monitoring software works, the main system types, the data worth tracking, real benefits, evaluation criteria, and a practical rollout path.
Key Takeaways
- Machine monitoring software links equipment data to dashboards, analytics, alerts, and improvement workflows.
- Start with core metrics: machine status, downtime, cycle time, output, quality, utilization, and OEE.
- Compatibility with legacy equipment, scalable architecture, and integration options should drive vendor selection.
- A focused pilot builds data confidence and a defensible ROI case before wider rollout.
How Machine Monitoring Software Works
Data has to travel a specific path before it becomes useful. It starts at the machine level: controllers, PLCs, machine logs, production databases, standard industrial protocols, or IIoT sensors. That raw data flows into an edge or gateway layer, gets normalized, and lands in cloud-based or on-premise software where it becomes readable information.

Capturing Data From Mixed Equipment
Manufacturers rarely run one type of machine, which is why capture methods vary:
- Direct controller connections via PLCs or PC-based systems
- Digital and analog inputs for simple status signals
- Standard industrial protocols such as OPC UA or Modbus
- Production databases and logs, pulled when direct integration isn't available
- Retrofit sensors for older or unconnected machines
Vistrian's FactoryLOOK follows this same approach, connecting to machine controllers, logs, databases, and IIoT devices to collect near-real-time equipment and process data across mixed fleets.
In one disk-media manufacturing deployment, a pilot pulled an average of 20 parameters per production tool at 2-5 readings per second. When a controller was inaccessible, a sensor-based gateway collected data directly from the machine.
Turning Signals Into Operational States
Raw data alone doesn't help anyone. The software converts signals into defined states—running, idle, stopped, faulted, setup, changeover, or maintenance—using consistent rules and downtime reason codes. Without that consistency, comparisons across shifts or machines become meaningless.
From Data to Decisions
Once states are established, the analytics layer calculates utilization, availability, throughput, cycle time, yield, OEE, and downtime duration. It compares performance by machine, line, shift, product, or facility, then surfaces the results through dashboards, reports, alerts, and mobile or browser access. That continuous visibility can give a plant accurate OEE without manual data entry.
Types of Machine Monitoring Systems and Data to Track
Not every plant needs the same monitoring approach. The right system depends on how fast decisions need to be made and what's at risk.
Real-Time Production Monitoring
Real-time monitoring tracks live machine status, downtime, run time, cycle counts, output, and alerts. It matters most in high-throughput or high-mix plants where a stopped line for 20 minutes can cascade into missed shipments. A supervisor watching a dashboard can react in minutes instead of finding out at shift change.
Historical Performance Monitoring
Time-series data reveals patterns real-time views can't: recurring bottlenecks, shift-to-shift variation, changeover losses, and underutilization. It's also how teams confirm whether an improvement initiative actually worked, rather than assuming it did.
Condition-Based and Predictive Monitoring
This layer tracks asset-health indicators like vibration, temperature, load, torque, power draw, and pressure. A condition alert flags a deviation worth investigating—not a confirmed failure prediction.
In one FactoryLOOK deployment, that distinction mattered directly. Sensors flagged a pneumatic actuator that was deteriorating but hadn't yet failed, giving maintenance time to plan a fix instead of reacting to a breakdown.
Deployment Architecture: Cloud, On-Premise, or Hybrid
| Factor | Cloud | On-Premises | Hybrid |
|---|---|---|---|
| Remote access | Strong | Limited | Strong |
| Multi-plant reporting | Easier | Harder | Moderate |
| Network dependence | Higher | Lower | Mixed |
| Data control | Shared with provider | Full internal control | Split |

Cybersecurity responsibility isn't automatically resolved by picking one model. NIST guidance on cloud services notes that customers and providers share accountability. The provider secures infrastructure; the customer configures access policies and secures application data.
What to Monitor First
Before adding condition sensors everywhere, prioritize:
- Machine state and downtime reason
- Cycle time
- Good and rejected parts
- Maintenance events
- One or two condition indicators tied to a known failure or quality risk
OEE as a Connected Framework
The data above rolls into OEE—a single effectiveness score from availability, performance, and quality, according to Lean Production's OEE reference. Define these terms consistently before comparing machines or plants; otherwise the comparison isn't valid.
Benefits and Use Cases for Manufacturers
Faster Reaction to Production Loss
When production data arrives hours late, problems that could be fixed in minutes cascade into stoppages and quality escapes. Real-time visibility flags a stopped machine, a string of short stops, or a cycle-time deviation as it happens—not at the end of a shift.
Finding Hidden Capacity
Downtime and utilization analytics expose things spreadsheets miss:
- Bottlenecks that shift between machines over time
- Hidden capacity that never shows up in manual reports
- Recurring loss categories by machine, line, or shift
In one case, continuous utilization tracking through FactoryLOOK traced throughput differences to a slowly deteriorating pneumatic actuator, even though the process recipe hadn't changed. That insight helped a chocolate manufacturer avoid more than $1 million in unnecessary capital spending by correcting a refiner-line bottleneck instead of buying new equipment.
Smarter Maintenance Prioritization
Condition data helps maintenance teams stop treating every asset as equally urgent. Vistrian's Maintenance Suite, when paired with FactoryLOOK, uses live machine data to flag abnormal conditions and coordinate parts and labor before a failure forces an emergency repair.
Quality and Process Improvement
Linking machine conditions to scrap, rework, and yield turns quality work from reactive to proactive:
- Event and alarm trends tie specific equipment events to yield losses
- Correlations surface without waiting on manual sampling
- Teams act on process drift before scrap piles up
Multi-Plant Visibility
For operations leaders managing several sites, standardized KPIs matter more than identical equipment. Consolidated dashboards across machine, line, plant, and enterprise levels let leadership compare performance without forcing every facility onto the same hardware.
That same visibility shows up in throughput gains on the plant floor. Case in point: Rockline Industries replaced paper and Excel-based tracking with monitoring software and reported an immediate 5% gain in OEE and throughput within weeks, reaching ROI in three months instead of the six months originally projected, according to a Rockwell Automation case study.
Vistrian Analytics and the Manufacturing Suite follow the same pattern—equipment integration, OEE, throughput, utilization, yield, and root-cause analysis in one platform instead of disconnected tools.
Choosing the Right Machine Monitoring Software
Compatibility Checklist
Before you compare features, lock down fit with your floor:
- Machine and controller compatibility across your existing fleet
- Support for legacy equipment (some platforms handle controllers decades old)
- Sensor requirements for unconnected machines
- Support for standard industrial protocols
- Data latency that matches your decision speed
- Ability to expand from one line to multiple facilities
Usability by Role
Each role needs a different view of the same data:
- Operators: simple status screens and fast reason-code entry
- Maintenance teams: actionable alerts instead of raw sensor feeds
- Engineers: granular, drillable data for root-cause work
- Managers: role-specific dashboards that summarize trends without noise
Integration and Governance
Confirm how the platform connects to the systems you already run—ERP, MES, CMMS, and historians—and how it stays secure across IT and OT.
Ask vendors to cover:
- APIs and integration patterns
- Identity management and role-based permissions
- Audit trails
- IT/OT network security design
Total Cost of Ownership
License fees are only part of the bill. Factor in:
- Edge hardware or sensors
- Integration work
- Implementation support and training
- Ongoing administration
Software-only deployment models that avoid hardware dependency typically cut implementation cost versus hardware-heavy alternatives.
Vendor Validation Questions
- Can you demo the platform on machines representative of ours?
- How is data quality verified against manual records?
- Does the system support custom states and parameters?
- What are our implementation responsibilities versus yours?
- Can you provide references from similar manufacturing environments?
Vistrian's modular, cloud-enabled platform works with legacy controllers and IIoT sensors, so manufacturers can start with one focused use case and expand later—without locking into a full enterprise rollout on day one.
Implementing Machine Monitoring Successfully
Start With One Problem, Not Everything
Pick a specific business problem: a downtime category costing real money, OEE blind spots, or unclear machine capacity. Trying to digitize every process simultaneously usually stalls before it delivers value.
Run a Structured Pilot
- Select representative machines that reflect real mix, constraints, and failure modes
- Document the current process and capture baseline downtime, output, and quality data
- Define who owns the data, the KPIs, and the improvement outcomes
- Connect equipment and validate states, counts, and reason codes against the floor
- Review results with operators and managers before scaling beyond the pilot

One FactoryLOOK pilot started with five production tools across three processes. Coverage then expanded to two critical operations, and later to seven plants across four countries.
Get Operators on Board
Adoption depends on trust. Three practices make that trust stick:
- Keep reason codes short so operators can log downtime without friction
- Deliver hands-on training on the floor, not a slide deck
- State the purpose clearly: improve the process, do not assign blame
Keep Data Quality Honest
- Synchronize time across systems
- Validate against manual or production records early on
- Define how missing signals get handled
- Lock down consistent KPI definitions
- Review reason-code accuracy periodically
Scale in Stages
Standardize connection templates, dashboard layouts, and governance rules before adding more lines or facilities. Skipping this step is how pilots turn into inconsistent, unmanageable rollouts.
Machine monitoring creates value when reliable data connects to a repeatable improvement process, not when it's collected for its own sake. If you're evaluating mixed equipment, multi-site visibility, or real-time analytics, a focused platform demonstration is a reasonable next step.
Frequently Asked Questions
What are the types of machine monitoring systems?
The main types are real-time production monitoring, historical performance monitoring, and condition-based or predictive monitoring. These can run on cloud, on-premises, or hybrid deployment models depending on network and data control needs.
What is an example of a machine monitoring system?
A connected manufacturing platform captures machine status, downtime, cycle time, output, quality, and equipment-condition data, then displays it through dashboards, reports, and alerts. Vistrian's FactoryLOOK is one example of this approach.
How does machine monitoring software differ from a CMMS or MES?
Machine monitoring focuses on equipment and production visibility, while a CMMS manages maintenance work orders and an MES handles broader manufacturing execution functions. These systems typically integrate rather than replace one another.
Can machine monitoring software work with older or unconnected machines?
Yes, through retrofit sensors, digital or analog inputs, controller connections, logs, databases, or IIoT gateways. Verify actual compatibility with your specific equipment during a pilot rather than assuming it based on general claims.
What data should a manufacturer monitor first?
Start with machine state, downtime reasons, run time, cycle time, part counts, and good-versus-rejected output, since these feed directly into OEE. Add condition indicators only when they relate to a known equipment or quality risk.