
Introduction
Most facility teams juggle maintenance requests in one system, asset records in another, and energy bills in a spreadsheet nobody updates on time. Vendor updates arrive by email. Budget numbers live in a finance tool the facility manager rarely opens.
This fragmentation costs time and money. When a critical HVAC unit fails, teams waste hours hunting for its maintenance history instead of fixing it.
A facility management dashboard solves this by pulling operational data into one place, showing KPIs, alerts, and trends that support real decisions. This guide covers what these dashboards do, which metrics matter, and how single-site and multi-site teams across the United States can build one that actually gets used.
Key Takeaways
- Every dashboard metric should help someone spot a risk, prioritize work, or justify a budget request.
- Pair live data with trends, thresholds, and drill-downs—a number without context is just noise.
- Match dashboard layout to your audience, facility type, and reporting cadence so each view drives action.
- Start with a focused KPI set; expand only after the data proves reliable.
What Is a Facility Management Dashboard?
A facility management dashboard is a centralized, digital view of building, asset, maintenance, safety, and financial information. It differs from a static spreadsheet or a monthly report in one key way: it updates continuously and lets users drill into the details behind any number.
A spreadsheet tells you last month's total repair cost. A dashboard tells you which building drove that cost, which asset failed most often, and whether the trend is getting worse.
Why This Matters for Decision-Making
According to FacilitiesNet's analysis of data-driven facility decisions, executives and operations staff need different things from the same underlying data. Executives want risk and return on investment translated into business language. Operations teams want direction on where to send technicians today.
A well-built dashboard serves both audiences from a shared, accurate data source. Teams typically gain:
- Faster issue detection through alerts instead of manual checks
- Stronger preventive maintenance by flagging overdue tasks before they become emergencies
- Better accountability since ownership of each metric is visible
- Clearer cost links between daily work and uptime, spend, and compliance
How It Relates to Your Other Systems
A dashboard isn't a replacement for your CMMS, building management system, or ERP. It's the decision layer sitting on top of them.
Your CMMS stores the work order. Your building management system logs the temperature reading. The dashboard pulls both together so a facility manager can see whether a comfort complaint links to an overdue PM task.
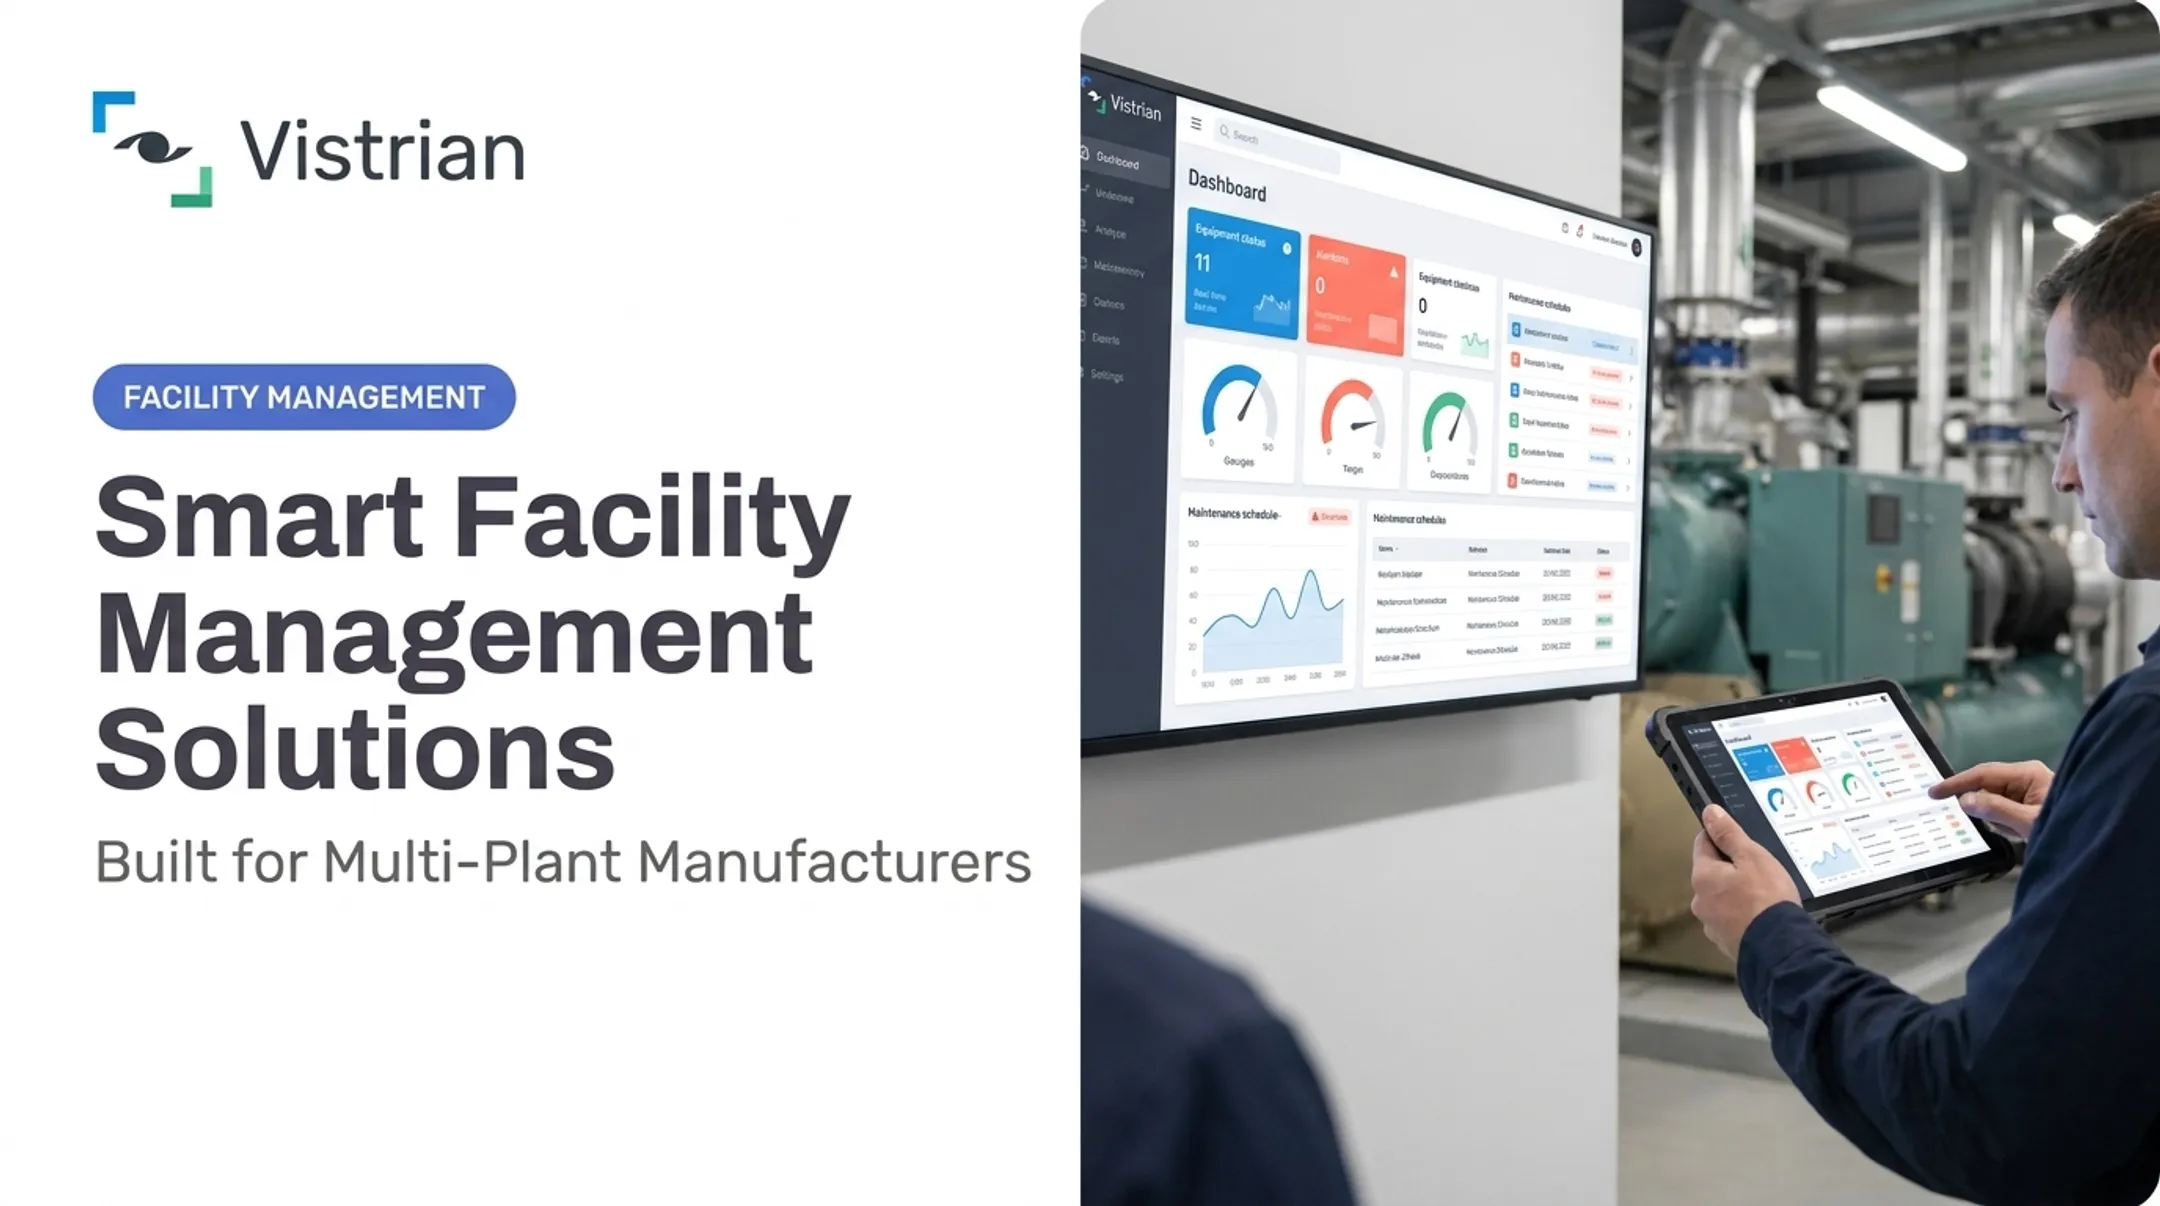
VistrianFMS works this way for facility and campus operations teams. It brings service requests, assets, and scheduled upkeep into one platform, then shows maintenance costs, vendor status, and open tickets in stakeholder dashboards—so managers do not have to check separate systems.
Essential KPIs for a Facility Management Dashboard
Not every metric belongs on a dashboard. The best ones map directly to a decision someone needs to make. IFMA's guidance on facility KPIs groups measures across maintenance, operations, finance, customer satisfaction, and vendor performance, which is a useful starting framework.
Maintenance Execution Metrics
These tell you whether work is getting done on schedule:
- Open and overdue work orders — flags where backlog is building
- Preventive maintenance (PM) compliance — shows whether scheduled upkeep is happening before assets fail
- Mean time to repair (MTTR) — measures how quickly issues get resolved
- Emergency-to-planned work ratio — high values signal a reactive operation
- Work order completion within SLA — connects daily work to service commitments
Asset and Facility Health Metrics
- Asset condition and mean time between failures (MTBF) — help decide repair versus replace
- Critical-asset availability — tracks uptime for equipment that can't afford to fail
- Deferred maintenance value — quantifies the risk of postponed work
Define calculation methods once and use them consistently across every site. Otherwise, comparing Building A to Building B becomes meaningless.
Service, Vendor, and Financial Metrics
Maintenance and asset health only cover part of the picture. Service delivery, vendors, cost, and safety need equal space on the same view.
| Category | Example Metrics | What It Tells You |
|---|---|---|
| Service quality | Request response time, first-time fix rate | Occupant experience |
| Vendor performance | SLA compliance, contractor scorecards | Whether outside partners deliver |
| Financial | Cost per work order, budget variance | Spending against plan |
| Safety/compliance | Incident rate, inspection completion | Risk exposure |

For safety benchmarking, BLS data on nonfatal occupational injury rates shows facilities support services reporting 2.1 recordable cases per 100 full-time workers, compared to 1.6 for real estate and rental/leasing. These are industry comparison rates, not universal targets, so use them as context rather than a strict benchmark for your own building.
Neither IFMA nor OSHA publishes a universal "good" rate for PM compliance or backlog. Set thresholds from your asset criticality and history, then track the trend.
Dashboard Types and Role-Based Views
Different roles need different views of the same data. A technician doesn't need budget variance. A CFO doesn't need a list of individual work orders.
Executive or Portfolio Dashboard
This view stays high-level: facility condition across the portfolio, total maintenance spend, budget status, and major compliance risks. It answers questions like "which sites need capital investment" without drowning the reader in ticket-level detail.
Operations Dashboard
Built for facility managers and supervisors, this view centers on today's work:
- Overdue tasks requiring immediate attention
- Technician workload and availability
- Open requests awaiting assignment
- Vendor performance flags
- Alerts that need escalation
Asset and Maintenance-Engineering Dashboard
This view supports drill-down: site to building, building to system, system to individual asset. It shows failure history, cost trends, and a recommended next action for each critical piece of equipment.
VistrianFMS applies this layered structure in practice. Its dashboards let a facility manager start with a downtime trend, then drill into the root cause and a suggested maintenance action within a few clicks, rather than pulling separate reports for each step.
Role-based permissions matter as much as the visuals. Whether people use the dashboard day to day also depends on:
- Saved views for each role
- Filters by site or asset class
- Mobile access for technicians in the field
- Exportable reports for board meetings
How to Design and Implement a Facility Management Dashboard
Start with the questions your team needs answered before you choose any charts. Which site is at risk? Where is preventive work falling behind? Which assets drive the most downtime?
Build the Foundation First
- Select a focused initial KPI set. Five to eight metrics beat twenty that nobody checks.
- Assign ownership to each metric — definition, data source, calculation method, threshold, and review cadence.
- Design a visual hierarchy. Summary cards up top, trend lines and exception lists below, drill-downs on demand.
- Use color coding for defined thresholds, not decoration. Red should mean "past the risk line you set," not "looks urgent."

According to FacilitiesNet, data governance has to be continuous, not a one-time setup step. KPIs shouldn't sit static either; they need periodic review, especially as vendor agreements or facility priorities shift.
Pilot Before You Scale
Test the dashboard with a small group of real users first. Validate every number against the source system, whether that's a CMMS, a spreadsheet, or a building automation feed.
After the pilot:
- Document user feedback and fix data mismatches before a wider rollout
- Train users on what each metric means, not only where to click
- Review every KPI quarterly and drop any that no longer earn screen space
Dashboard Data, Integrations, and Governance
Your dashboard is only as good as the data feeding it. Common sources include:
- CMMS or facility management software (work orders, PM schedules)
- Asset registers and inspection forms
- Building automation systems and energy meters
- Access, occupancy, and finance platforms
- Vendor records and legacy spreadsheets
Integration Realities
Legacy equipment doesn't always talk in a modern format. Standard protocols like BACnet handle HVAC, fire/life safety, security, and lighting data exchange for building automation, according to ASHRAE's BACnet standard. Where a direct feed isn't available, IIoT sensors or manual log entry can fill the gap.
Document data gaps instead of hiding them. A dashboard that presents incomplete data as precise insight creates false confidence, which is worse than admitting a blind spot.
Governance Non-Negotiables
- Consistent asset IDs and site hierarchies across every system
- Clear ownership of each data field
- Defined refresh frequency for each metric
- Role-based access controls
- Periodic cybersecurity review for connected building systems
Those ownership and consistency rules are easier to enforce when maintenance, assets, and vendor data live in one system instead of five. VistrianFMS supports that model by handling:
- Maintenance cost tracking
- Service and preventive maintenance scheduling
- Vendor management
- Customizable alerts and dashboard-ready reporting
For teams that also run production, Vistrian Analytics and the Management Suite can combine facility data with plant-floor metrics. Multi-site operators get consolidated monitoring without standing up separate reporting stacks for each function.
Conclusion
A facility management dashboard earns its place when it links trustworthy data to clear ownership and timely action. Adding more metrics to a screen doesn't accomplish that on its own.
Build it in this order:
- Start with a small, decision-focused KPI set
- Validate the data against your source systems before you trust it
- Add role-based views as your team's reporting needs grow
- Expand the dashboard only when you're confident in what's feeding it
Frequently Asked Questions
What is a good dashboard for facilities management?
A good dashboard combines role-relevant KPIs, current data, historical trends, alerts, and drill-down detail across maintenance, assets, costs, service quality, and compliance. It should point users toward a specific action, not just display numbers.
How do I view my dashboard?
Access typically comes through your facility management or CMMS platform via browser or mobile login, with permissions determining what you see. If you don't have access, contact your system administrator to set up your role-based view.
What should be included in a facility management dashboard?
Include open work orders, preventive maintenance status, asset health, service levels, maintenance costs, safety and compliance indicators, alerts, and trend data. Filter by site or building for multi-location teams.
Which KPIs should a facility management dashboard track?
A focused starting set includes PM compliance, overdue work orders, mean time to repair, SLA performance, asset condition, maintenance cost, budget variance, and safety indicators. Final selection should match your specific business goals, not a generic template.
How does a facility management dashboard improve maintenance?
Centralized visibility helps teams prioritize overdue and critical work, spot recurring equipment failures, and monitor preventive maintenance completion in one place. This shift moves operations from reactive firefighting toward planned, proactive maintenance.
Can a facility management dashboard monitor multiple sites?
Yes. Multi-site dashboards compare locations using standardized KPI definitions, flag outliers, and support enterprise-level reporting. Users can drill down from portfolio performance to a specific building, asset, or individual work order.