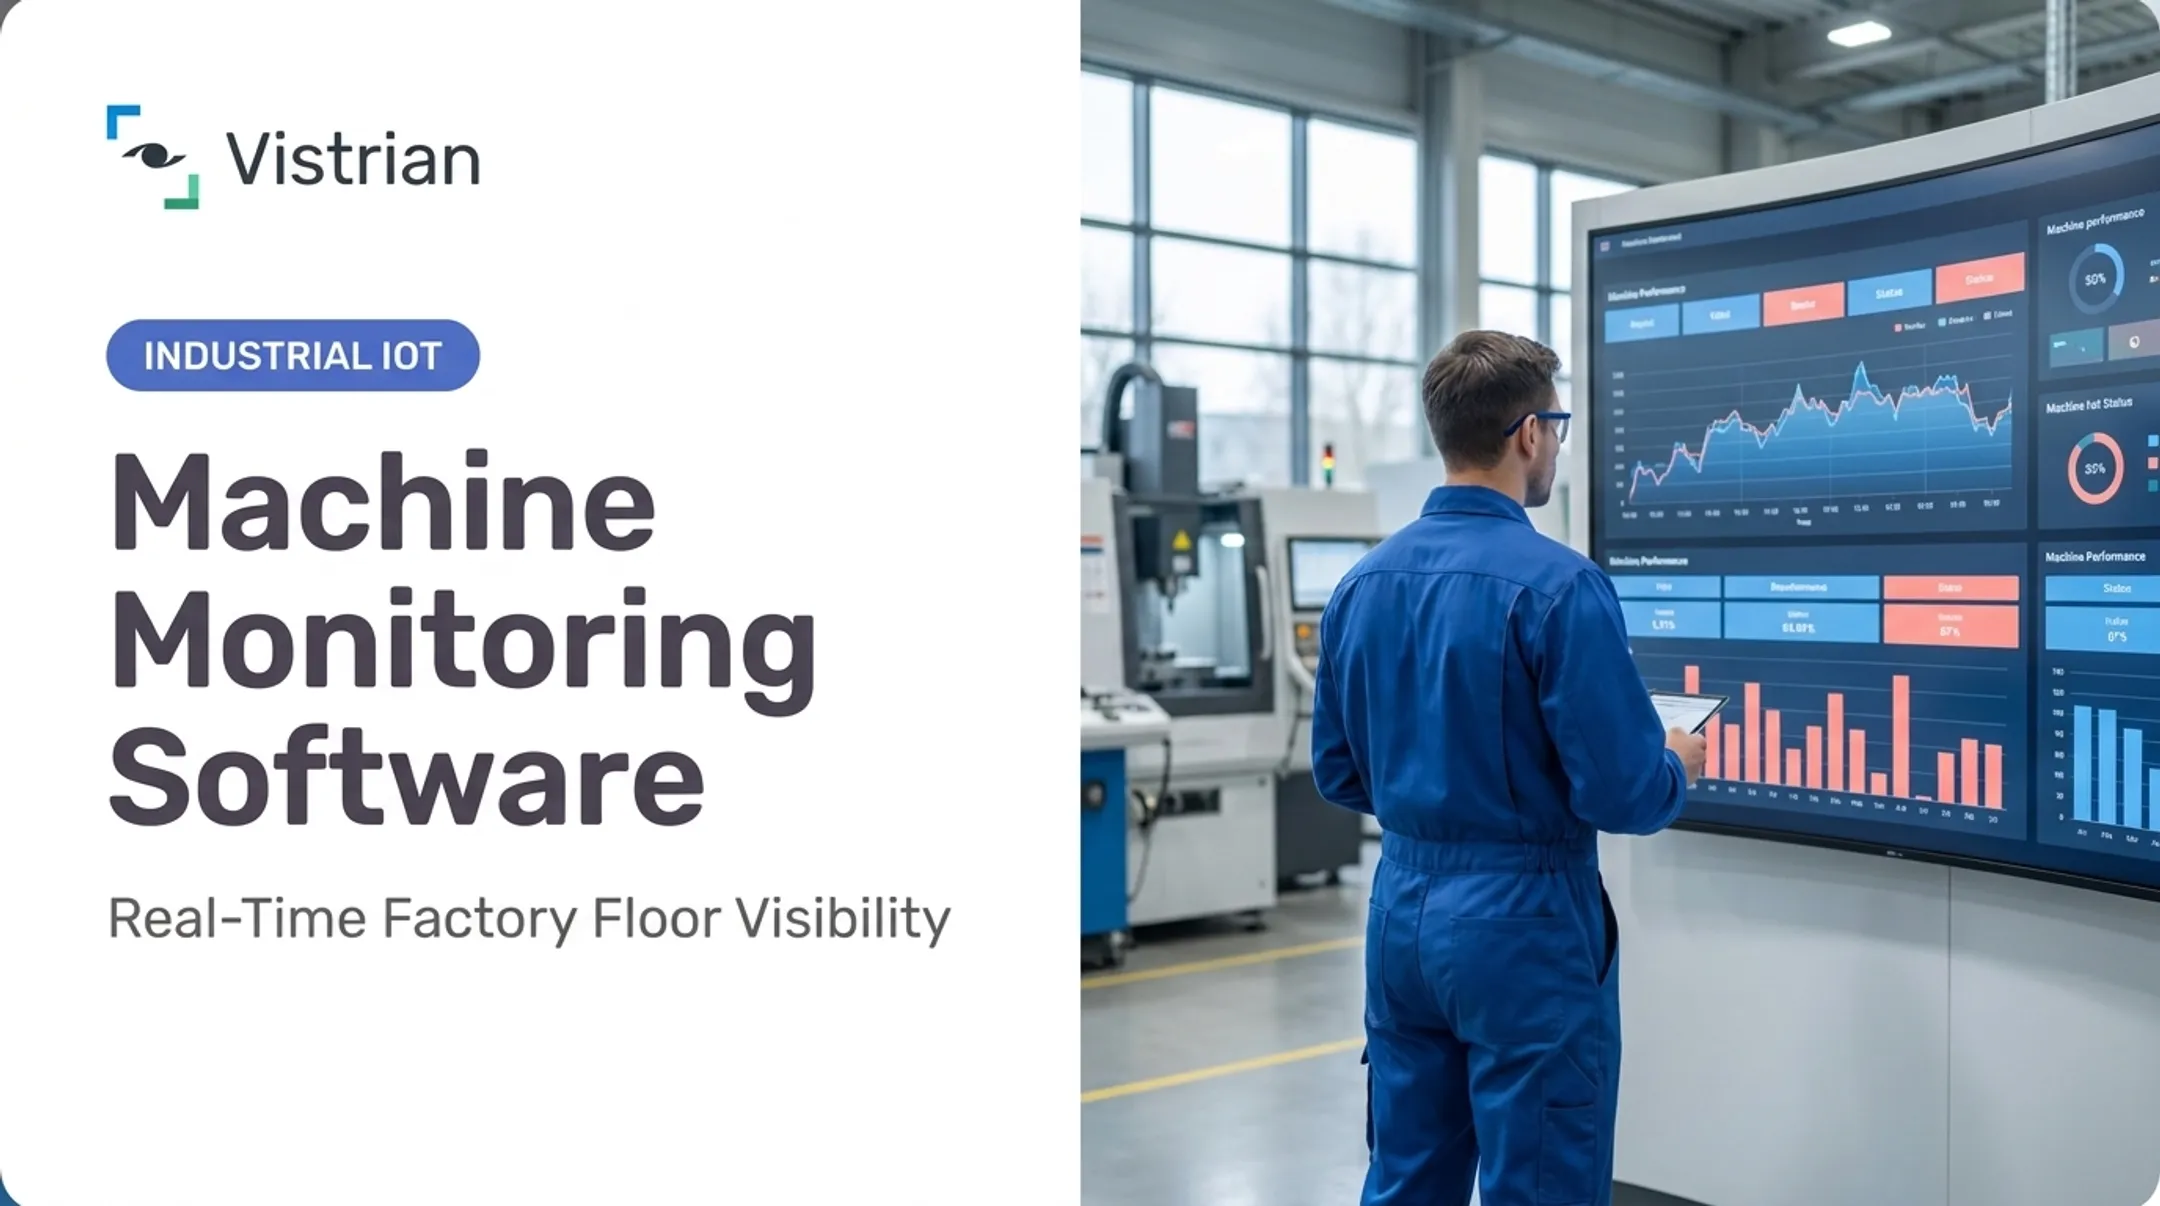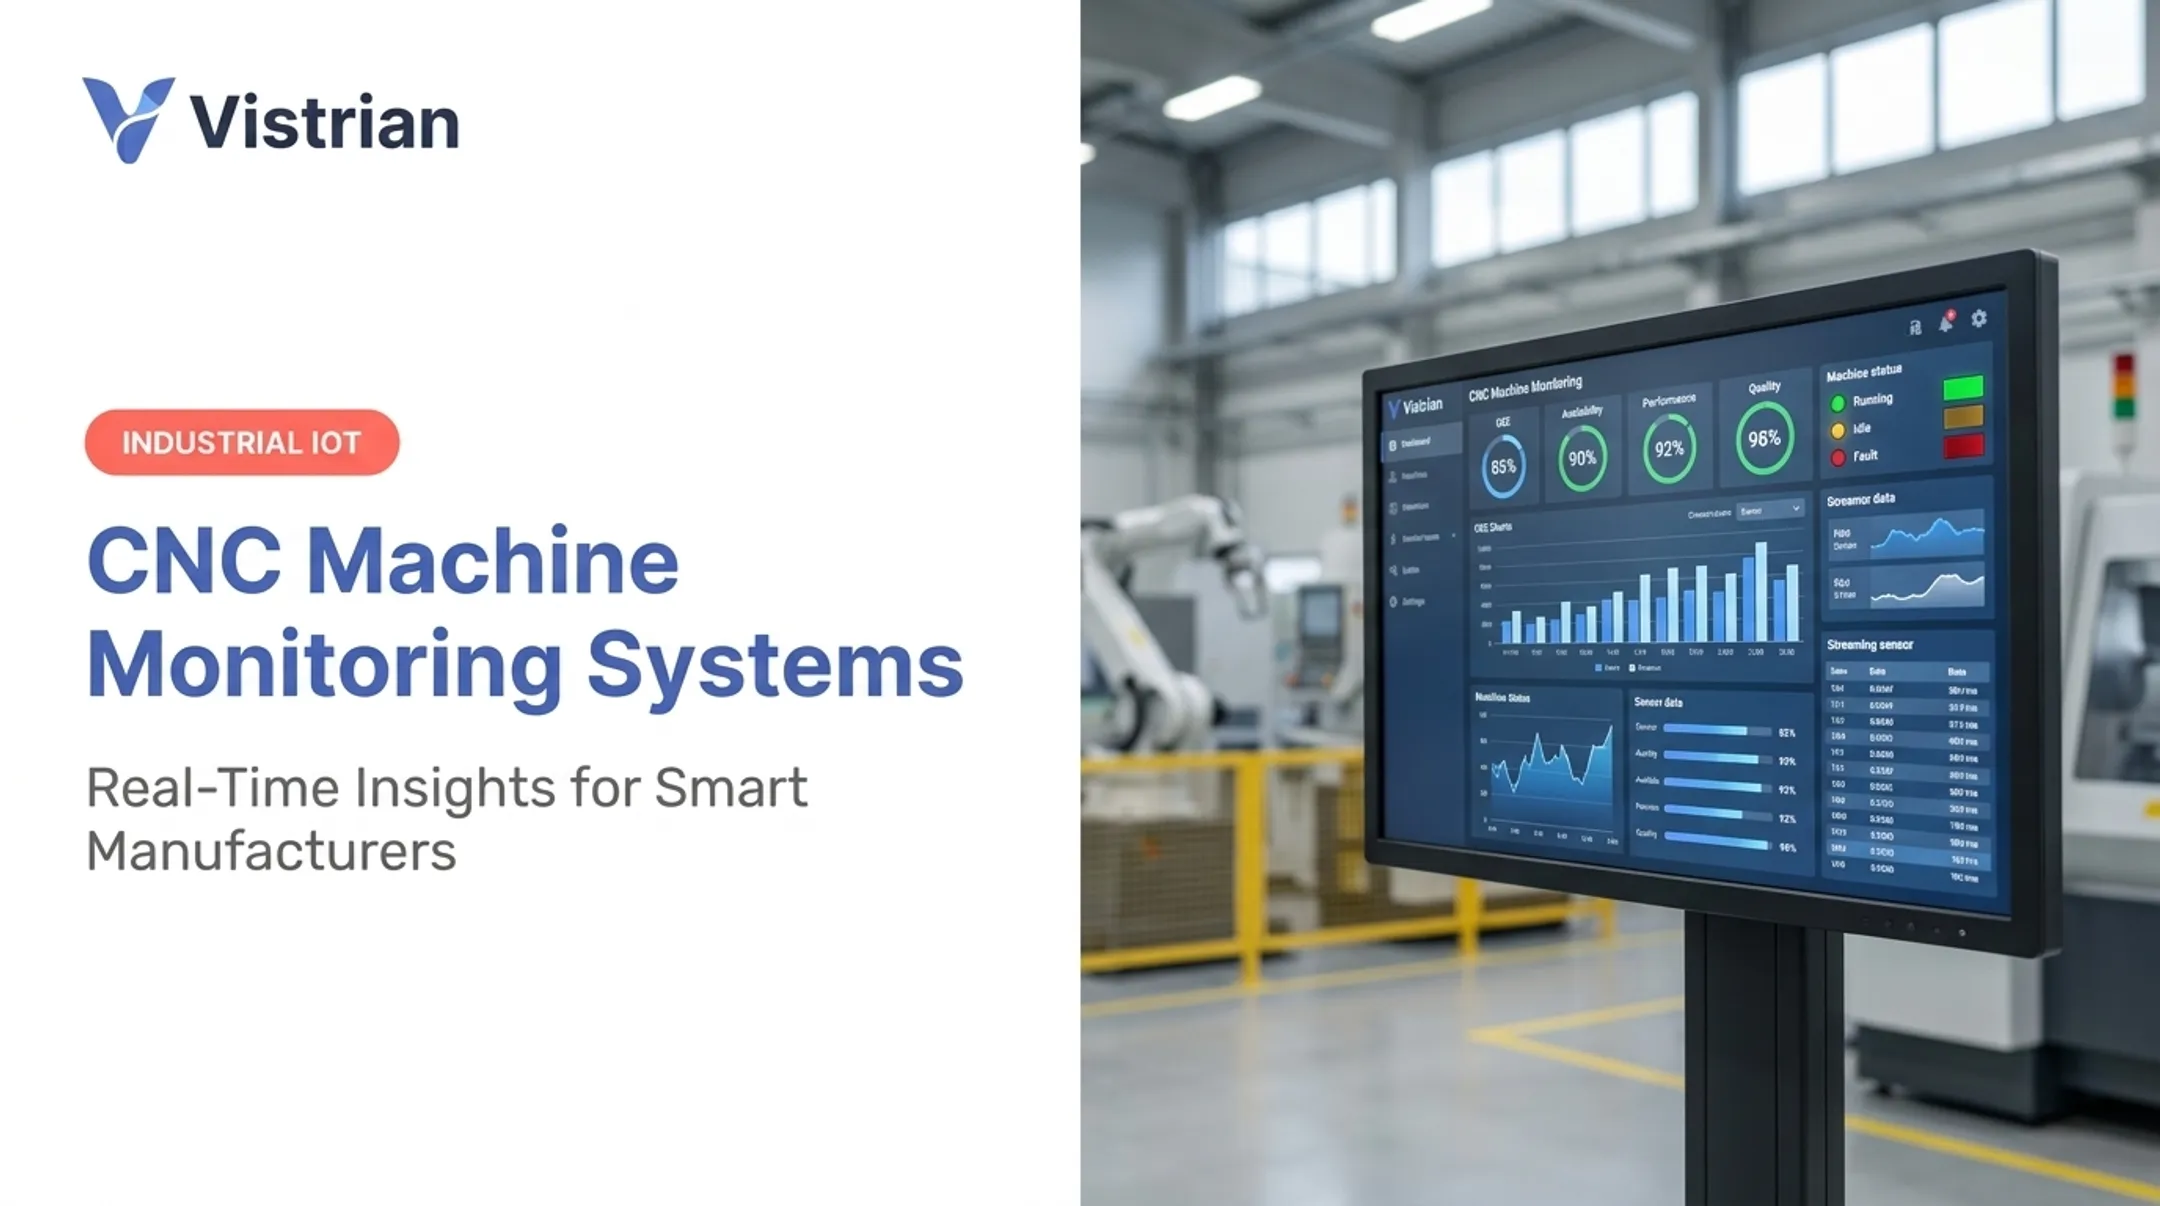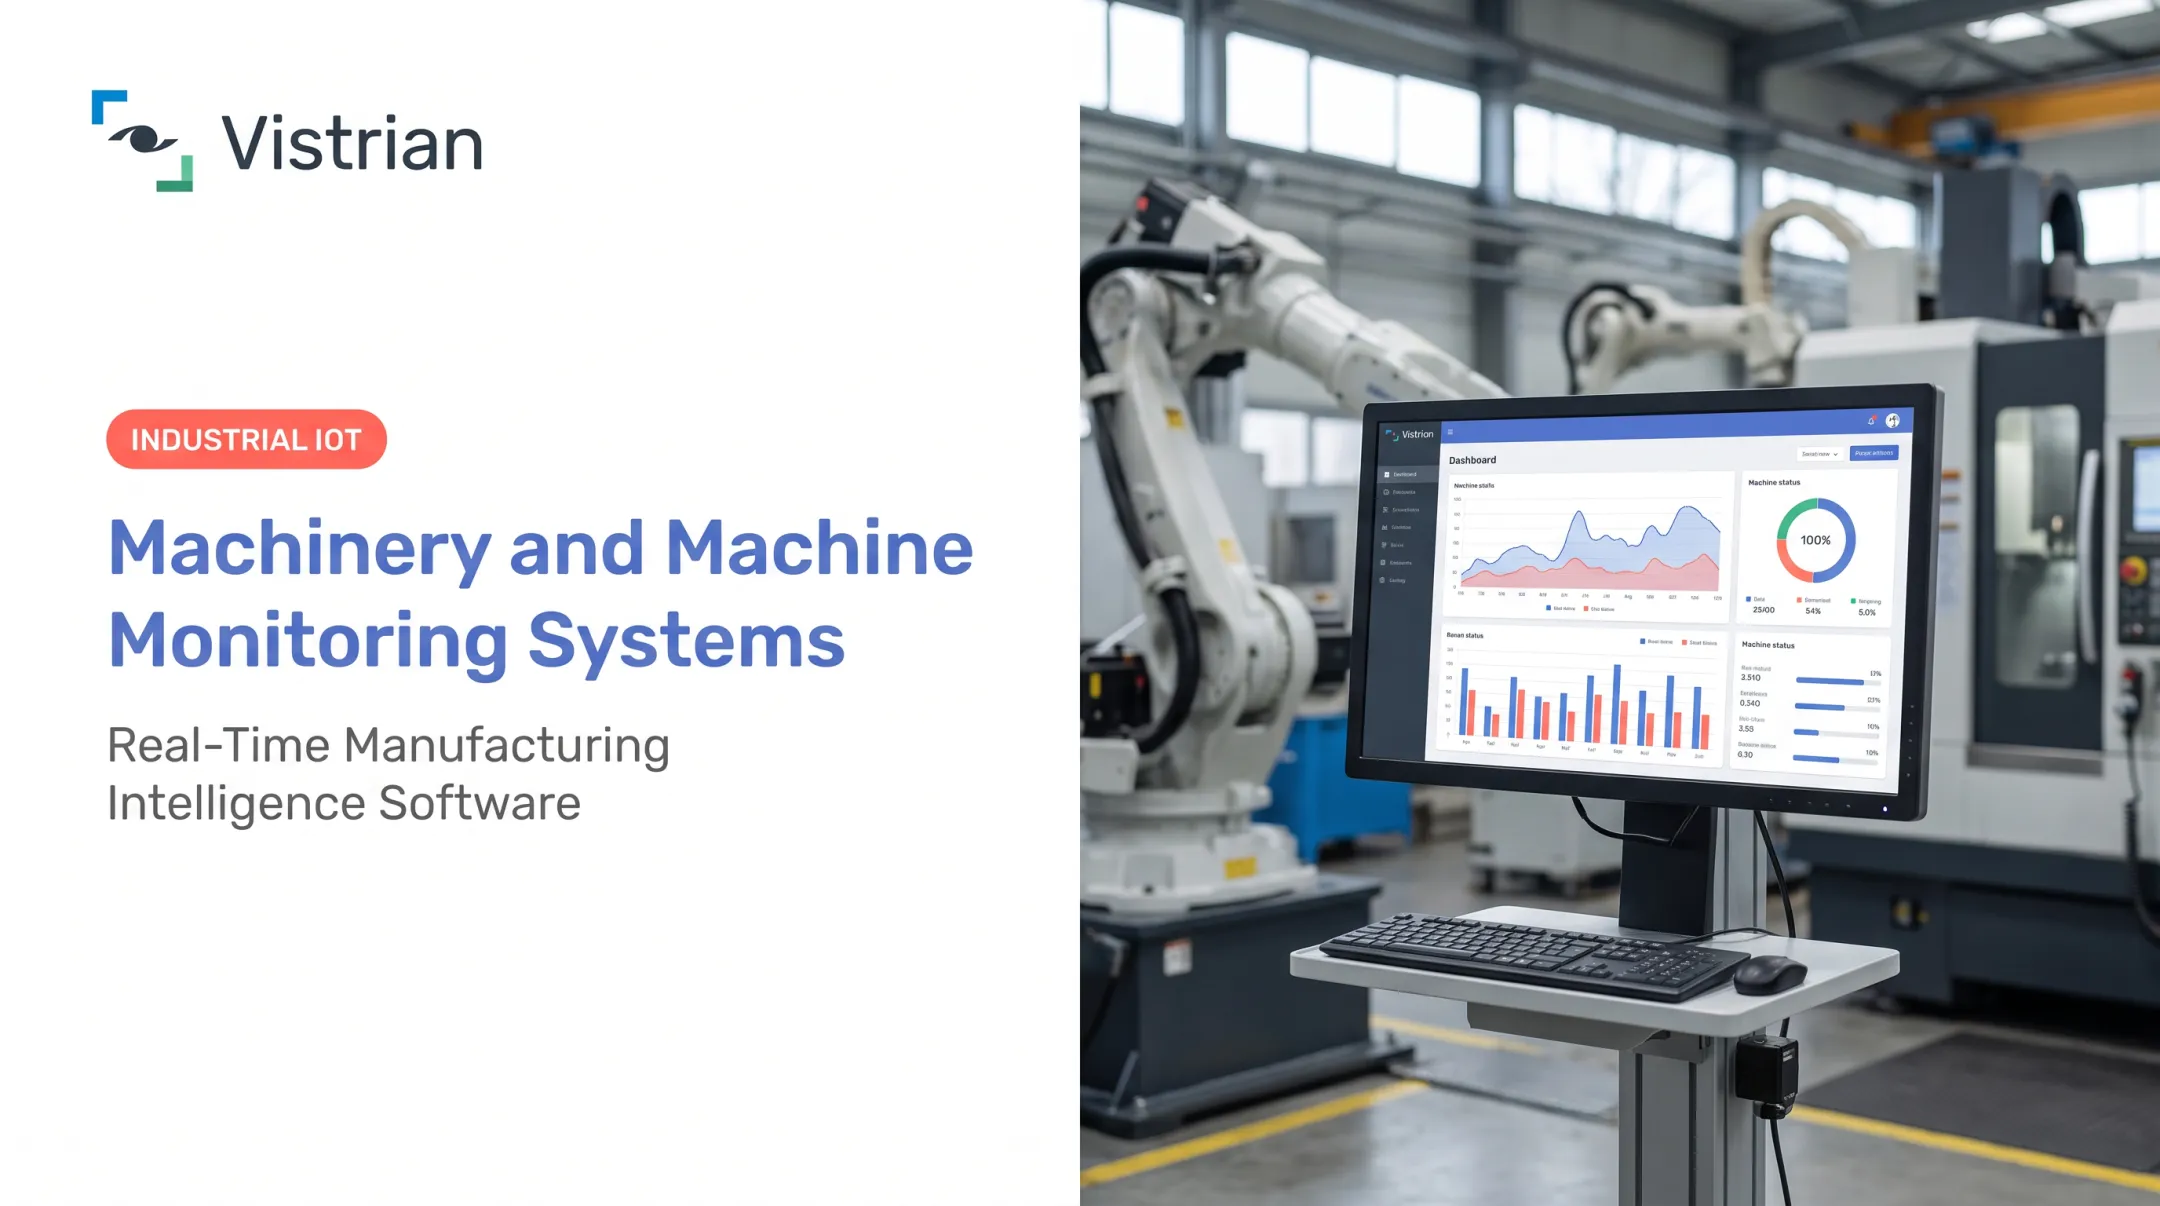

That gap between "what happened" and "what's happening right now" costs real money. A 2025 Fluke survey found that 55% of US manufacturers experienced unplanned downtime in the past year, with capital impact reaching $207 million weekly across the industry. Nearly half of affected plants reported 6-10 downtime incidents per week.
An IoT-based machine monitoring system closes that gap. It connects equipment, sensors, industrial networks, and software so machine events become operational information you can act on before they become a crisis.
This article covers how these systems work, what benefits manufacturers actually see, which features matter when evaluating a platform, and how to implement one without disrupting production.
Key Takeaways
- IoT machine monitoring turns equipment and sensor data into near-real-time dashboards and alerts teams can act on
- Faster downtime response, higher equipment utilization, earlier maintenance flags, and tighter quality control
- Success depends on interoperability with existing equipment, secure connectivity, and clear alert ownership
- Predictive maintenance needs reliable historical data and the right analytics, not sensors alone
What Is an IoT-Based Machine Monitoring System?
An IoT-based machine monitoring system is purpose-built software that observes manufacturing equipment and production activity, then turns raw signals into decisions operators, maintenance teams, and plant leaders can use immediately.
The National Institute of Standards and Technology (NIST) frames Industry 4.0 as connecting machines, people, and physical assets into a digital ecosystem that generates, analyzes, and communicates data — sometimes acting on it without human intervention. Machine monitoring is the operational layer of that concept.
These systems pull data from multiple sources:
- Machine controllers and PLCs for direct connections to equipment logic
- Industrial protocols for standardized data exchange (more on this below)
- Databases and logs when direct access isn't available
- Retrofit IIoT sensors that add monitoring to older machines
What Information Does It Actually Provide?
A well-implemented system typically shows:
- Machine run state, idle time, and downtime duration
- Cycle time and throughput
- Temperature, vibration, and pressure readings
- Energy-related signals
- Quality conditions and maintenance events
Vistrian's FactoryLOOK platform, for example, connects to PLCs and PC-based controllers through standard industrial protocols. When direct integration isn't possible, it pulls equipment data from logs or databases instead — a practical workaround for plants with a mix of old and new machines.
Monitoring, Alerting, and Prediction Are Different Things
Buyers often treat these as one capability. Installing sensors gives you monitoring. It does not automatically give you prediction.
- Monitoring shows current conditions
- Alerting flags when conditions cross a threshold
- Automation triggers a response without human input
- Predictive maintenance forecasts failure before it happens, and needs historical context rather than live data alone
Each role puts the same data to different use: operators act on floor conditions, maintenance teams track equipment health trends, production leaders manage capacity and bottlenecks, and executives compare performance across plants.
How an IoT-Based Machine Monitoring System Works
Data moves through six stages:
- Collection from machines and sensors
- Connectivity across the plant network
- Processing at the edge or in a gateway
- Storage in a historian or platform
- Analysis against baselines and models
- Action through dashboards, alerts, and workflows

The Core Components
- Machine interfaces and controllers expose operating states, counters, alarms, and process values
- IIoT sensors add monitoring to older equipment that lacks digital interfaces
- Gateways and industrial protocols normalize and transmit data securely
- A platform or historian stores time-series and event data for analysis
- Dashboards and alerts deliver information to the people who need it
MTConnect provides a semantic vocabulary that lets manufacturing equipment publish structured data without a proprietary format. Paired with OPC UA for service-oriented security, the two protocols let machines from different vendors share a common language—essential on plant floors that mix brands and generations.
Common Sensor Types and What They Reveal
| Sensor Type | Typical Use |
|---|---|
| Vibration | Detects bearing wear, imbalance, misalignment |
| Temperature | Flags overheating, monitors chemical process limits |
| Pressure | Tracks pneumatic/hydraulic system consistency |
| Current | Reveals motor load and electrical anomalies |
| Acoustic | Catches abnormal frequencies before failure |
| Proximity | Confirms part presence or machine positioning |
Vibration is usually the first signal teams instrument, and for good reason. Rockwell Automation's condition-monitoring research links vibration analytics to wear, imbalance, misalignment, and bearing degradation across motors, pumps, fans, gearboxes, and compressors. Those same failure modes show up in the other sensor channels above, which is why multi-signal context matters more than any single reading.
Threshold Alerts Need Context
Setting a vibration threshold at "anything above X" sounds simple. In practice, normal operating vibration varies by machine age, load, and even ambient temperature. Thresholds set without that context generate alert fatigue — operators start ignoring notifications because too many are false alarms.
A practical example: During one FactoryLOOK deployment, the system detected ultrasonic-generator power readings surging to four times expected levels for short durations during each cycle. That pattern, invisible on a whiteboard tracking system, pointed engineers directly to the root cause instead of a lengthy manual investigation.
Vistrian's Manufacturing Suite brings equipment integration, IIoT connectivity, historian storage, analytics, and alerting together in one modular platform, including support for legacy controllers up to 40 years old.
Benefits and Manufacturing Use Cases
Replacing whiteboards and spreadsheets with live dashboards isn't just cosmetic. It changes how fast problems get caught and fixed.
Operational Benefits That Matter Most
- Faster downtime response: teams see issues as they happen, not at the next shift huddle
- Better equipment utilization: schedule from actual machine state instead of assumptions
- Earlier abnormal-condition detection: supports condition-based maintenance before failure
- Improved process consistency: continuous monitoring catches drift that periodic checks miss
- More informed capital decisions: data shows whether a bottleneck needs a new machine or a process fix
Connecting Monitoring Data to KPIs
Map raw feeds to the metrics teams already manage against:
- OEE (Availability × Performance × Quality) shows where losses concentrate: low availability points to downtime; low quality points to defects
- Throughput and cycle time pinpoint which process step is the real bottleneck
- Mean Time Between Failures (MTBF) guides preventive-maintenance intervals
- Mean Time to Repair (MTTR) flags gaps in spare-parts stocking or technician training
These metrics apply across discrete manufacturing, semiconductor fabs, process manufacturing, and CNC environments alike — though the specific sensors and thresholds differ by asset type.
A Real Outcome: Bottleneck Identification Saves Over $1 Million
In a documented FactoryLOOK deployment at a large cocoa and chocolate ingredient manufacturer, real-time throughput data showed the true bottleneck was plumbing between refiners and holding tanks, not the equipment teams first suspected. That insight helped the company avoid more than $1 million in ineffective capital spending, with projected OEE improvement above 20%.
Separately, an Emerson case study on a five-site industrial rollout reported a 3.5% increase in plant reliability worth $1.44 million annually. The same program delivered 23% higher throughput and 66% lower maintenance costs on key components, showing the gains are not limited to one vendor's platform.

For multi-plant operations leaders, the same visibility supports site-to-site comparison and standardized reporting so improvement spend goes where losses actually concentrate.
Core Features and Metrics to Evaluate
Not every platform handles every plant environment well. Before comparing dashboards, define what your equipment mix demands.
What to Compare
Gartner's industrial IoT evaluation criteria point to a consistent set of capabilities buyers should weigh: equipment connectivity, protocol support, integration depth, scalability, and vendor support.
In practical terms, that means checking for:
- Retrofit sensor compatibility for legacy machines
- Real-time and historical dashboard views
- Role-based access for different teams
- API access for MES, ERP, or CMMS integration
- Multi-site scalability
Why Interoperability Is the Real Test
A plant with legacy PLCs, modern CNC machines, standalone sensors, and three different equipment vendors needs a platform that doesn't force a single-vendor standard. This is where many monitoring projects stall — not on the software, but on getting data out of a 20-year-old controller in the first place.
FactoryLOOK's approach handles this by falling back to logs or databases when direct controller integration isn't available, and by using retrofit sensors (branded internally as Vistrian Spider) to continuously collect data even when a machine controller is inaccessible.
Raw Data vs. Actionable Alerts
Buyers should separate four layers of signal:
- Raw sensor readings — a temperature value at a point in time
- Machine events — a state change, like idle-to-running
- Calculated KPIs — OEE, yield, cycle time derived from multiple events
- Actionable alerts — a notification tied to a specific owner and next step

Skipping straight to alerts without reliable downtime reason codes creates a system nobody trusts—so ask how the vendor handles context, not just numbers.
Quick Evaluation Checklist
Before signing anything, confirm the platform addresses:
- Data ownership and where data physically lives
- Cybersecurity controls at the endpoint and network level
- MES/ERP/CMMS integration points
- Behavior during connectivity outages
- Scalability beyond the pilot scope
Evaluate against a defined pilot use case, not dashboard aesthetics or a sensor-count checklist.
How to Implement an IoT Machine Monitoring System
Start with the business problem, not the technology.
Step-by-Step Approach
- Define your priority outcome (downtime reduction, OEE improvement, maintenance planning, or multi-plant reporting) and document your current baseline
- Prioritize pilot assets using production criticality, downtime cost, and failure frequency
- Audit the existing environment: PLCs, machine logs, network infrastructure, sensor gaps, and cybersecurity requirements
- Choose connection methods per asset: direct controller links where data exists, retrofit sensors where it doesn't, and gateways when you need local buffering
- Roll out the pilot and validate data against shop-floor reality before scaling

One documented rollout started with 5 production tools across 3 processes, pulling roughly 20 parameters per tool at multiple readings per second. It later covered 100% of tools in two critical operations, with payback in under six months.
That kind of expansion only holds if the operating rules are in place before you scale.
Governance Can't Be an Afterthought
Before rollout, establish:
- Naming conventions for assets, machine states, and downtime categories
- Alert ownership covering who acknowledges, who escalates, and how fast
- Access permissions by role so operators and executives see the right views
Security Guidance Worth Following
NIST's 2023 OT security guidance recommends these core controls:
- Discover and inventory all connected devices
- Segment IT from OT networks
- Configure logging for operational and cybersecurity events
Test encryption for latency before you deploy. A delay of even a few milliseconds can matter on time-sensitive equipment.
Vistrian addresses these expectations by storing data inside customer firewalls and offering secure browser-based remote access, so plants can meet OT security needs without a full network overhaul.
Frequently Asked Questions
What is an IoT-based monitoring system?
It's a network of connected sensors, machines, and software that collects and analyzes operational data. The goal is real-time visibility, automated alerts, and faster action on equipment issues.
What is the most common IoT sensor?
There isn't one universal sensor. Temperature, vibration, proximity, pressure, and current sensors are all common. The right choice depends on the asset and what you're trying to monitor.
How does an IoT-based machine monitoring system work?
Data moves from machines and sensors through a connectivity layer, gets processed and stored, then surfaces through dashboards and alerts. Operators and maintenance teams respond based on what they see.
What data can an IoT machine monitoring system collect?
Typical data includes machine run state, downtime, cycle time, temperature, vibration, pressure, alarms, energy signals, and maintenance events, depending on the sensors and connections in place.
Can IoT monitoring connect to legacy manufacturing equipment?
Usually, yes. Legacy equipment can often connect through existing controllers, industrial protocols, machine logs, or retrofit IIoT sensors, subject to a compatibility and cybersecurity assessment.